Key Highlights
- Climate change is measurable. Long-term records show clear changes in temperature, rainfall, drought and heat over decades, not just in single unusual years.
- Weather and climate are different things. One hot summer says little on its own. Patterns observed over 75 years say a great deal.
- Public climate data is already available. Copernicus and NOAA both provide open historical records, reanalysis datasets and projections.
- Access is the real barrier. Scientific data stores assume you know which dataset you need and how to process it.
- Data and memory can disagree. Human memory favours unusual events, and short-lived local extremes can be smoothed out by the dataset. The gap between the two often leads to better questions.
Is climate change for real? Yes. Long-term climate data shows measurable changes in temperature and other climate patterns over time.
But global averages can still feel abstract.
We don’t experience climate change as a global temperature anomaly. We experience it in a particular place: a summer that feels hotter than the ones we remember, winters with less snow, longer dry periods, changing rainfall, or a landscape that somehow looks different from twenty years ago.
That is where the question becomes more personal:
What does climate change look like where you live?
With Local Climate Stories, we wanted to make it easier to explore that question using more than 75 years of climate data and documented methodology for a location you actually know.
What does climate data actually show?
Weather describes what is happening over a short period of time: today’s temperature, this week’s rainfall or one particularly cold winter. While climate describes patterns over much longer periods.
One unusually hot summer does not, by itself, tell us much about climate change. But when temperature, rainfall, drought and heat are observed over decades, longer-term patterns become visible.
Scientists use different types of climate data to understand these changes.
Some information comes directly from observations such as weather stations, satellites, ships and weather balloons. Reanalysis datasets combine large numbers of these observations with atmospheric physics to reconstruct consistent weather conditions across places and periods where direct measurements alone are incomplete.
These long-term records make it possible to compare today’s conditions with previous decades and understand how the climate around a location is changing. The data exists, but the challenge is often accessing and interpreting it.
Where can you find climate data online?
There is an enormous amount of climate data online. Two important public sources are Copernicus and NOAA.
The European Union’s Copernicus Climate Change Service provides climate information through the Copernicus Climate Data Store. It gives researchers, governments, businesses and organisations access to historical climate records, reanalysis datasets and climate projections.


One of its most widely used datasets is ERA5, the global reanalysis produced by the European Centre for Medium-Range Weather Forecasts.
NOAA, the US National Oceanic and Atmospheric Administration, also provides extensive historical weather and climate records through services such as NOAA Climate Data Online.
These platforms provide the scientific foundation for countless climate analyses. But they are primarily data platforms. Using them often requires knowing which dataset you need and how to process or interpret it.
For someone simply wondering: “Was summer always this hot here?” opening a scientific climate data store is probably not the most intuitive place to start.
Local Climate Stories: Turning trusted climate data into something local
Local Climate Stories starts with something much simpler: a location.
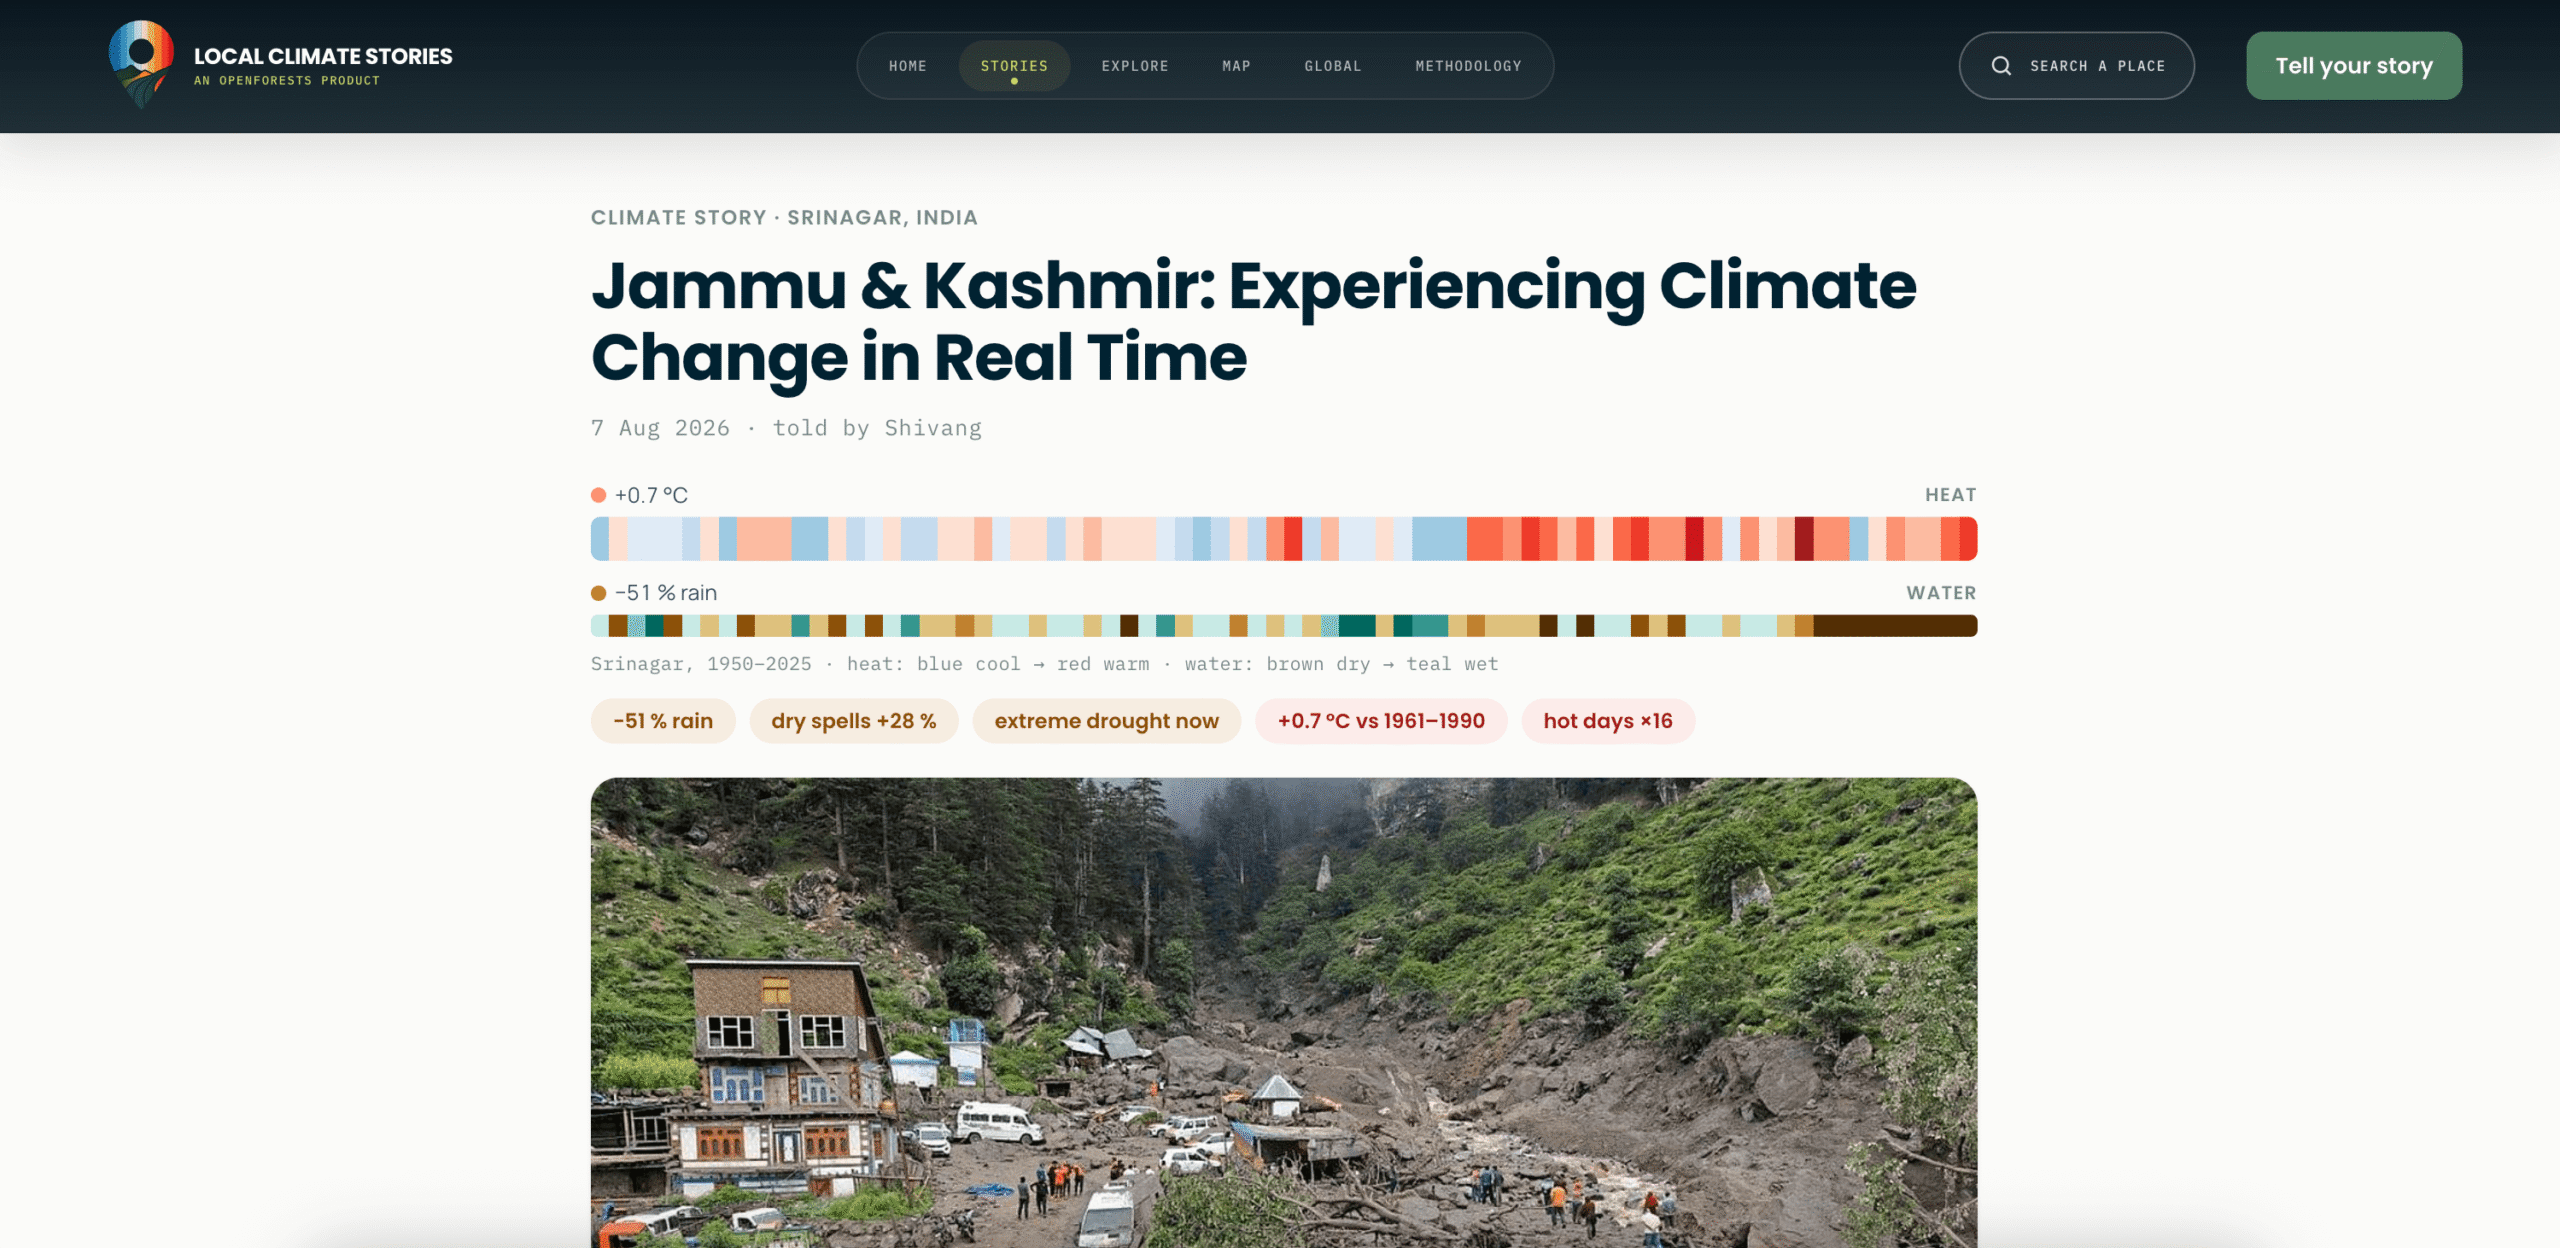
Search for somewhere you know, and the tool shows how climate conditions around that location have developed over time.
You can explore more than 75 years of data related to:
- Temperature
- Tropical nights
- rainfall
- Drought
- dry spells
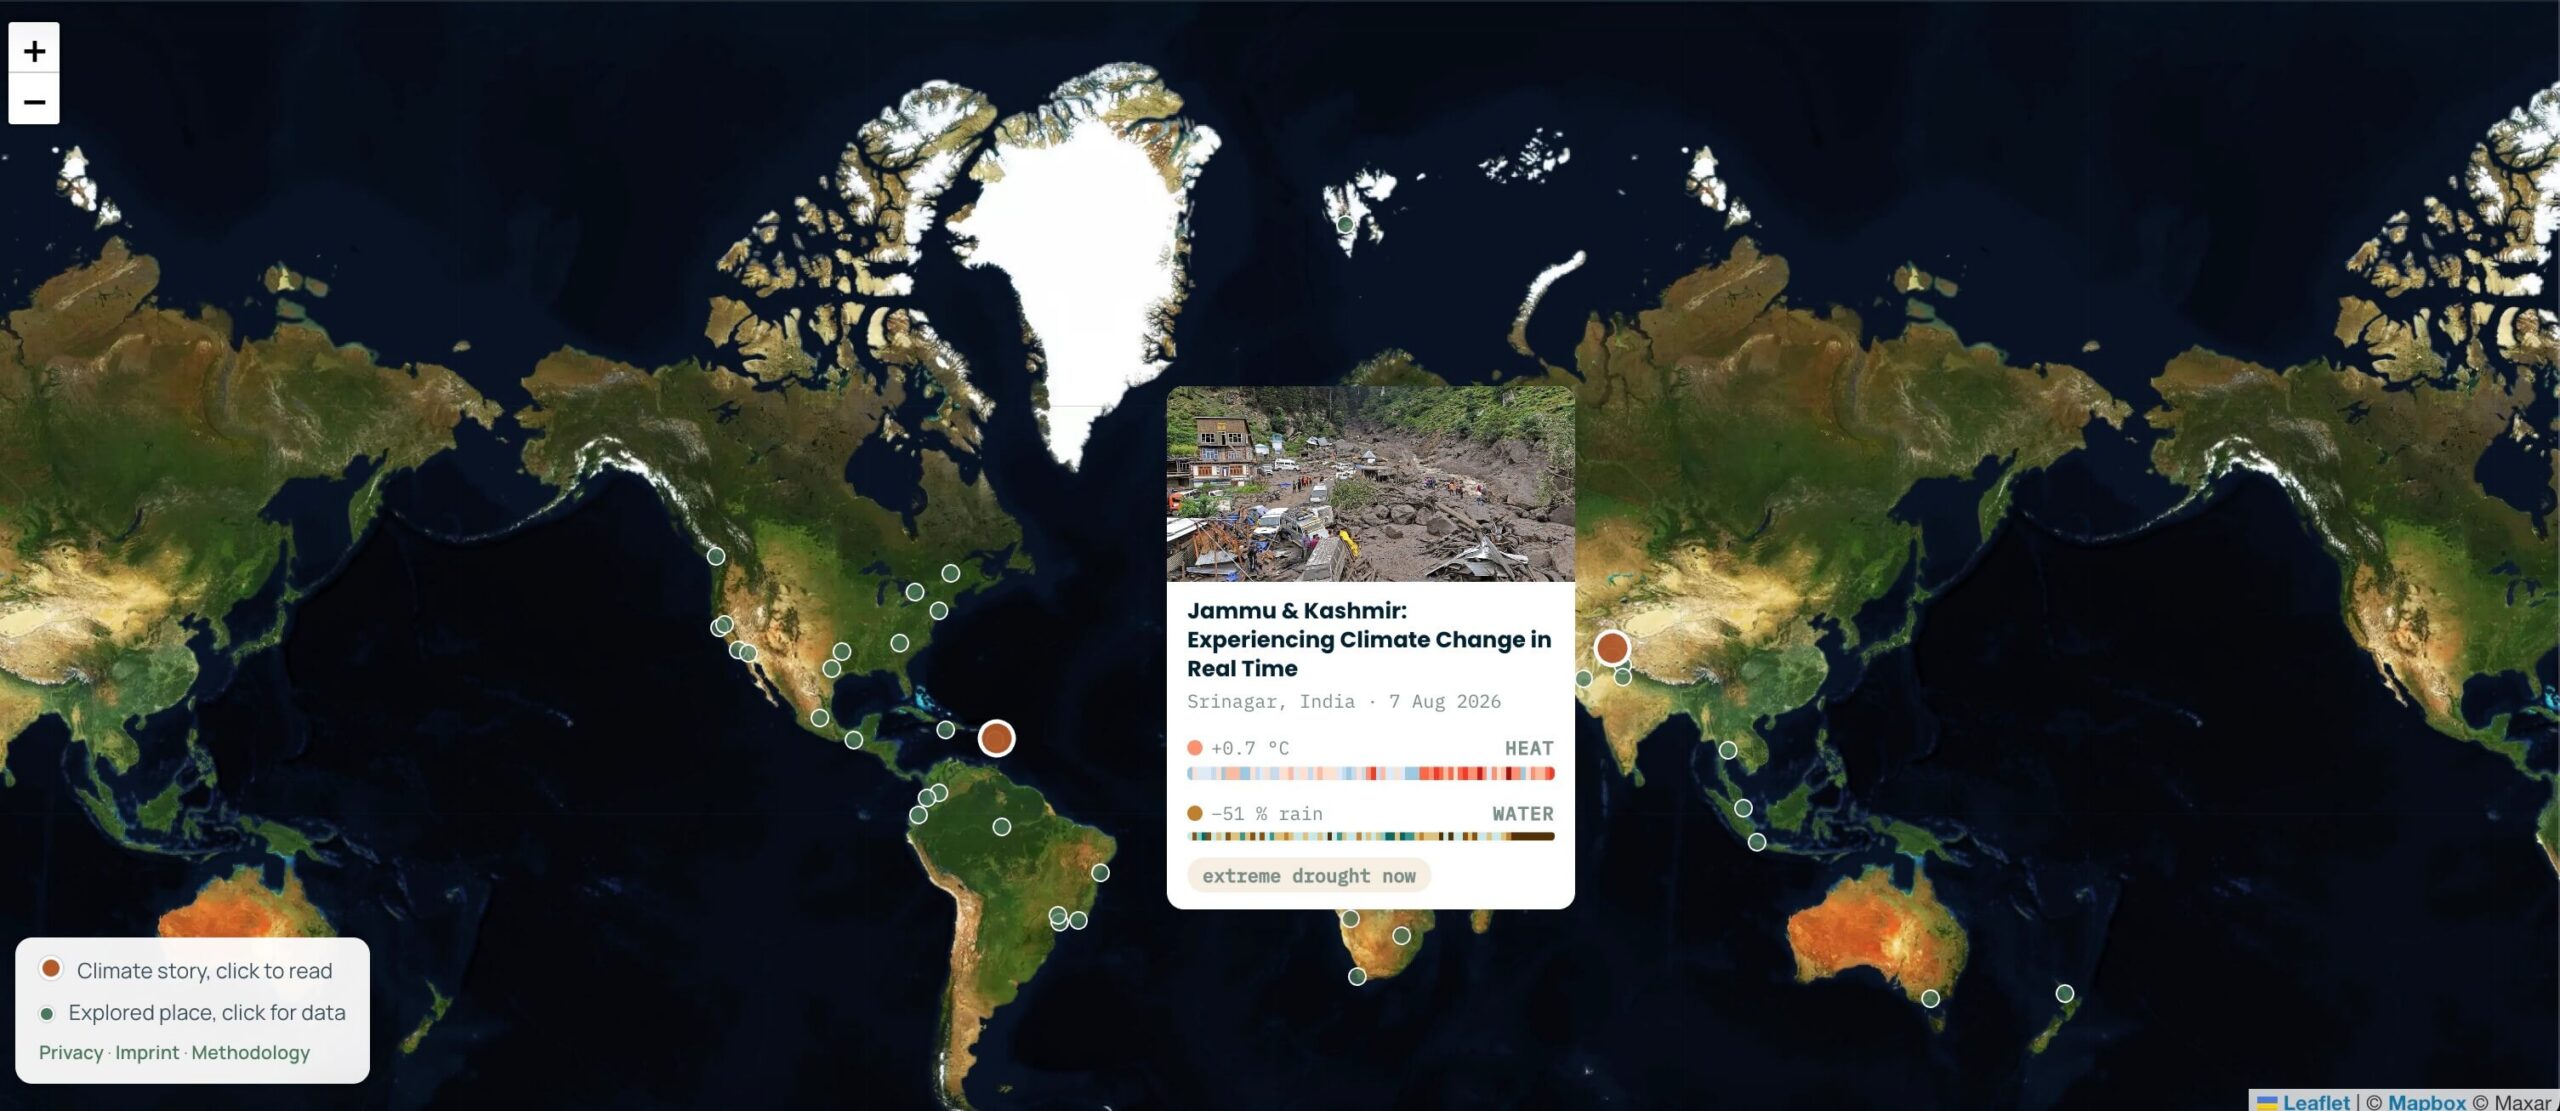
For the local historical record, Local Climate Stories uses ERA5 and ERA5-Land data from the Copernicus Climate Change Service, accessed through Open-Meteo.
The record goes back to 1950 and compares conditions against the 1961–1990 reference period.
For the outlook towards 2050, the tool uses three high-resolution CMIP6 climate models.
We have documented where the data comes from, how each indicator is calculated, the baselines used, the spatial resolution, the future scenarios and the limitations of the datasets on our Data & Methodology page.
This is important to us, because we don’t want Local Climate Stories to be a black box that simply gives you a graph and asks you to trust it.
You should be able to understand where the numbers come from, what they mean and what they cannot tell you.
Local Climate Stories is therefore not another climate data store. Its purpose is to make existing scientific climate data easier to explore at the scale of a location people know.
Was it always like this?
This question was one of the starting points for the project.
We often have surprisingly strong memories of climate.
The winters when snow stayed for weeks. The summer when the lawn turned brown. A lake that used to freeze regularly. The year a river became unusually low. A farming season everyone remembers as exceptionally wet.
These memories matter because they are part of how we understand change. So after exploring the climate data for a location, Local Climate Stories invites you to add another layer: your own experience of that place.
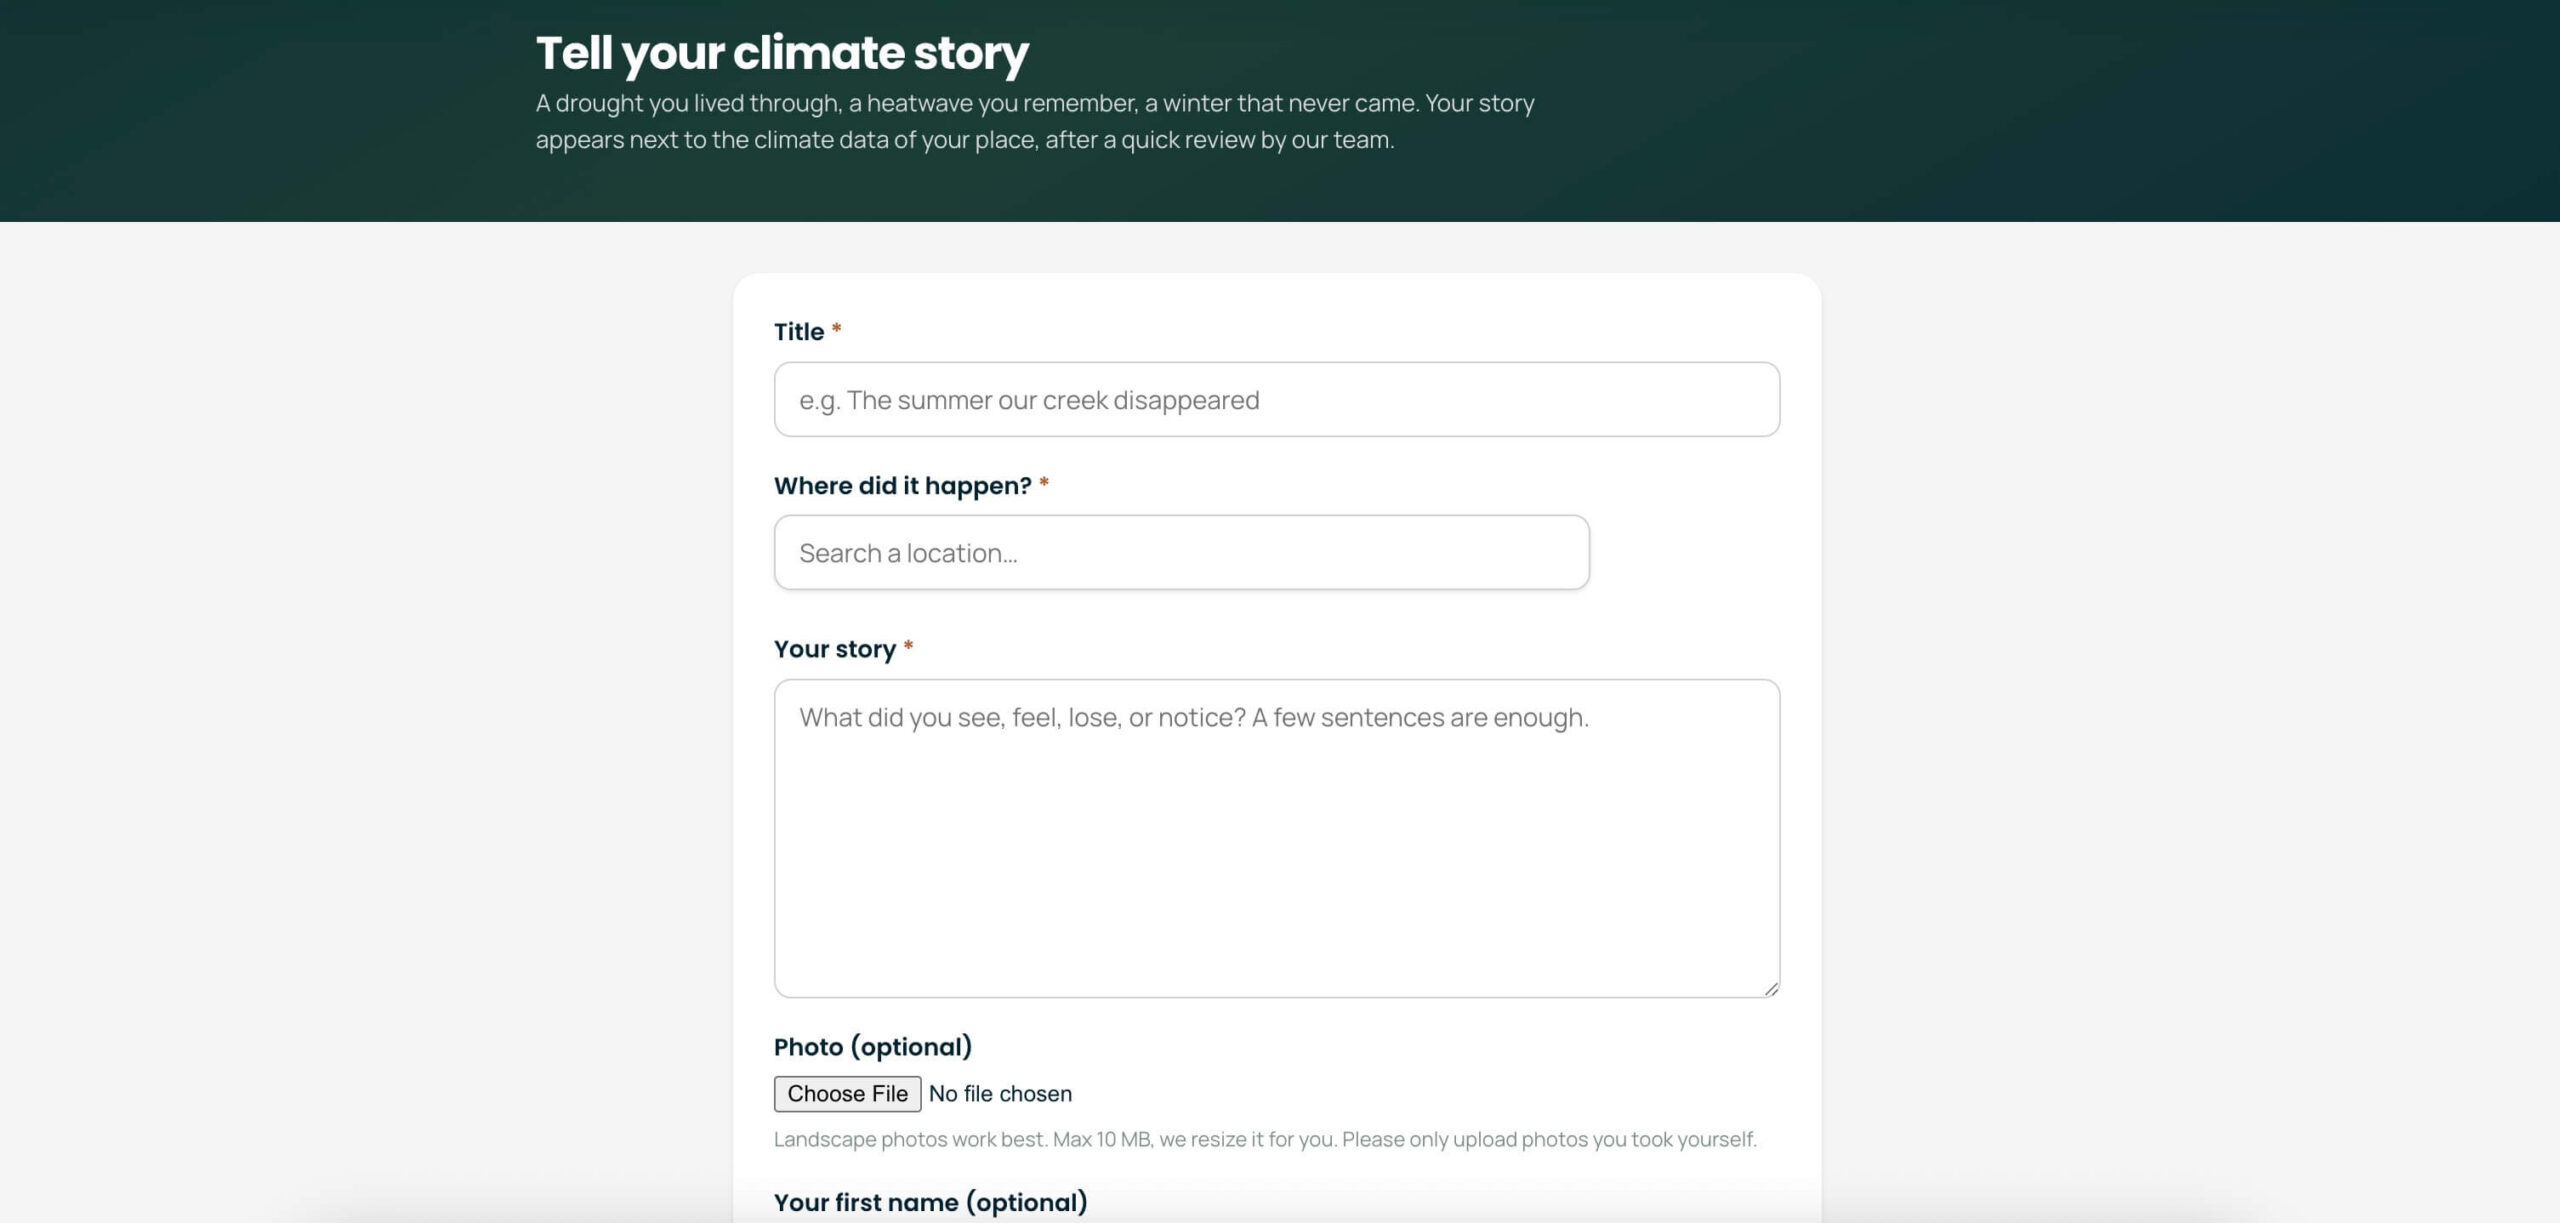
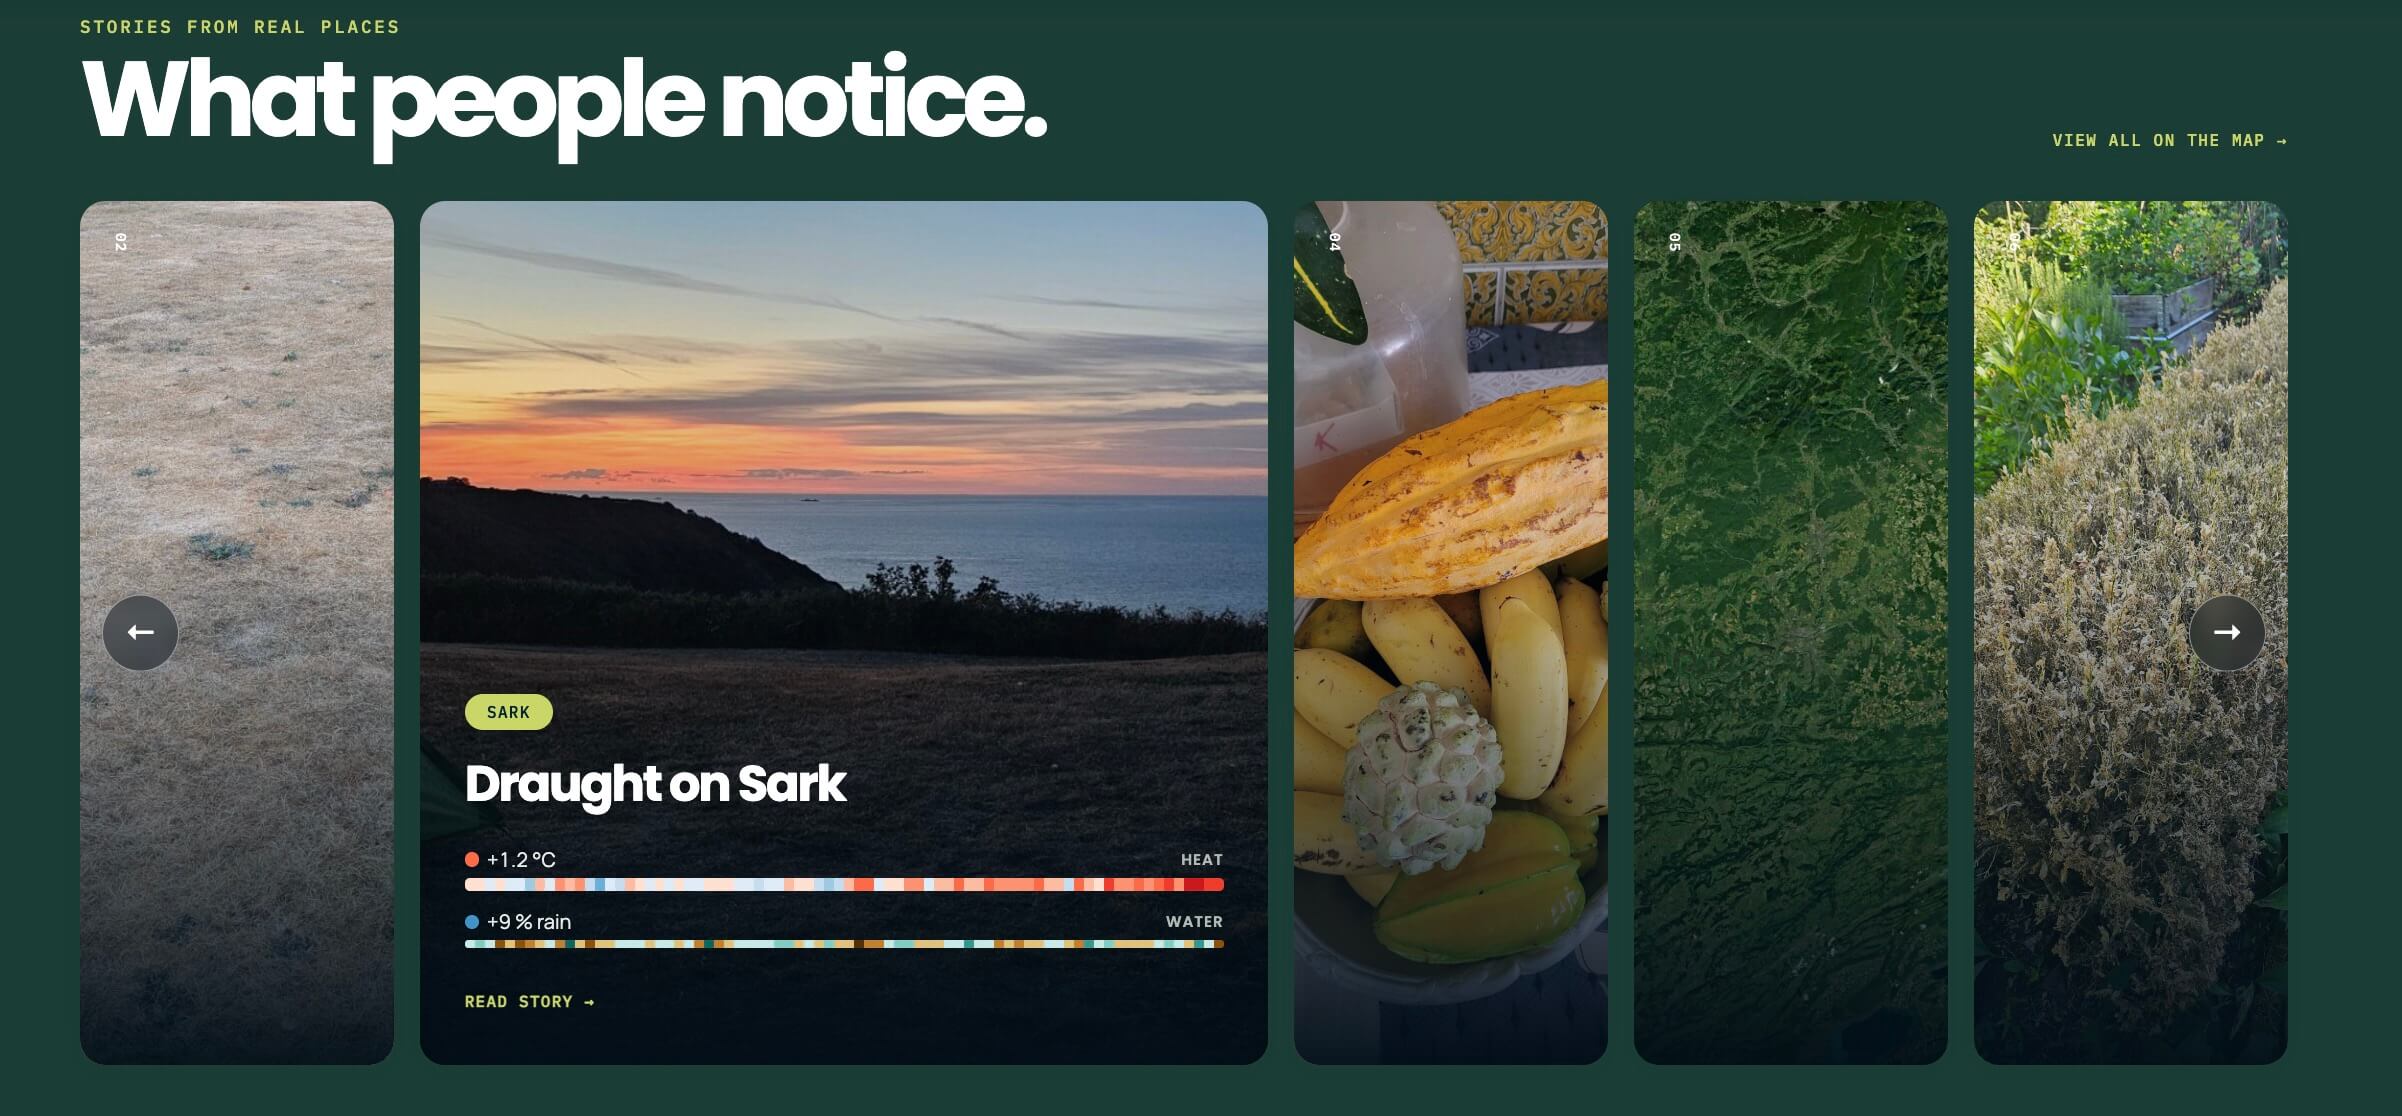
You can contribute a memory, indicate when it happened and add a photo. The story then becomes part of the map alongside other experiences.
When climate data and memory don’t tell exactly the same story
Sometimes the climate data will reflect exactly what you remember. Sometimes it won’t.
That is not necessarily a problem. Human memory is selective. We tend to remember unusual events particularly strongly, while climate datasets help us examine conditions and trends over much longer periods.
And the data has limitations too. ERA5, for example, does not represent a thermometer positioned on your street. Local historical values represent grid cells of roughly 10–25 km. Topography, vegetation, altitude and other local factors can therefore make conditions at one precise point different from the wider area represented by the dataset.
Older periods also carry greater uncertainty because fewer observations were available, while very local or short-lived extremes can be smoothed out by the spatial and temporal resolution of the data.
Being transparent about those limitations is as important as showing the data itself.
That is why the methodology explains not only how the indicators are calculated, but also where the underlying datasets have blind spots and how far individual results should be interpreted.
Local Climate Stories should not be understood as a replacement for a local weather station or detailed site-level climate assessment. Instead, it provides a way to explore the broader climate record around a place and compare it with lived experience.
And sometimes the difference between the two is itself interesting, because it can lead to better questions:
- Why do I remember this year so clearly?
- Was the temperature unusual, or was it rainfall?
- Is the change I noticed visible over decades?
- How different are the last ten years from the climate I grew up with?
From a global problem to local experience
Climate change is usually communicated globally.
We hear about global average temperatures, emissions targets, climate models and scenarios. All of these are necessary for understanding the scale of the problem. But climate change does not arrive everywhere in exactly the same way. A global average is made up of many different local realities.
Some regions warm faster than others. Rainfall patterns evolve differently from one landscape to another. Drought, heat and extreme weather affect ecosystems and communities in different ways. Looking at climate change locally gives us another way to understand it.
Why did OpenForests build Local Climate Stories?
Local Climate Stories is a relatively small experiment, but the idea behind it is closely connected to how we work at OpenForests.
Today, environmental organisations have access to more data than ever: Satellite imagery, Climate data, Field observations, Biodiversity information, Monitoring indicators, Maps, Reports.
The challenge is increasingly not simply collecting information.
It is turning that information into something people can understand, explore and use.
- Where did change happen?
- How has it developed over time?
- How does one location compare with another?
- What does the data mean for the people and ecosystems affected?
- And how can that information be communicated transparently to people who are not technical experts?
A large part of our work at OpenForests focuses on exactly that intersection between environmental data, geography and communication.
Local Climate Stories applies the same principle to climate change:
- Start with trusted, publicly available data.
- Be transparent about the methodology and its limitations.
- Put the information on the map.
- Make it interactive and explorable.
- Connect it with the people who know those places.
Explore the climate data for a place you know
Start with somewhere that means something to you: Your hometown, the landscape where you work, the village where you grew up, a forest you visit regularly, a place your family has known for generations.
Look at the climate data.Explore the temperature, rain, drought and heat records. See how recent years compare with earlier decades.
And if you want to understand exactly where a number comes from or how an indicator was calculated, explore the full Data & Methodology.
Then ask yourself: Was it always like this?
And if you have a memory worth sharing, add it to the map.
Because climate change is global. But every climate story happens somewhere.