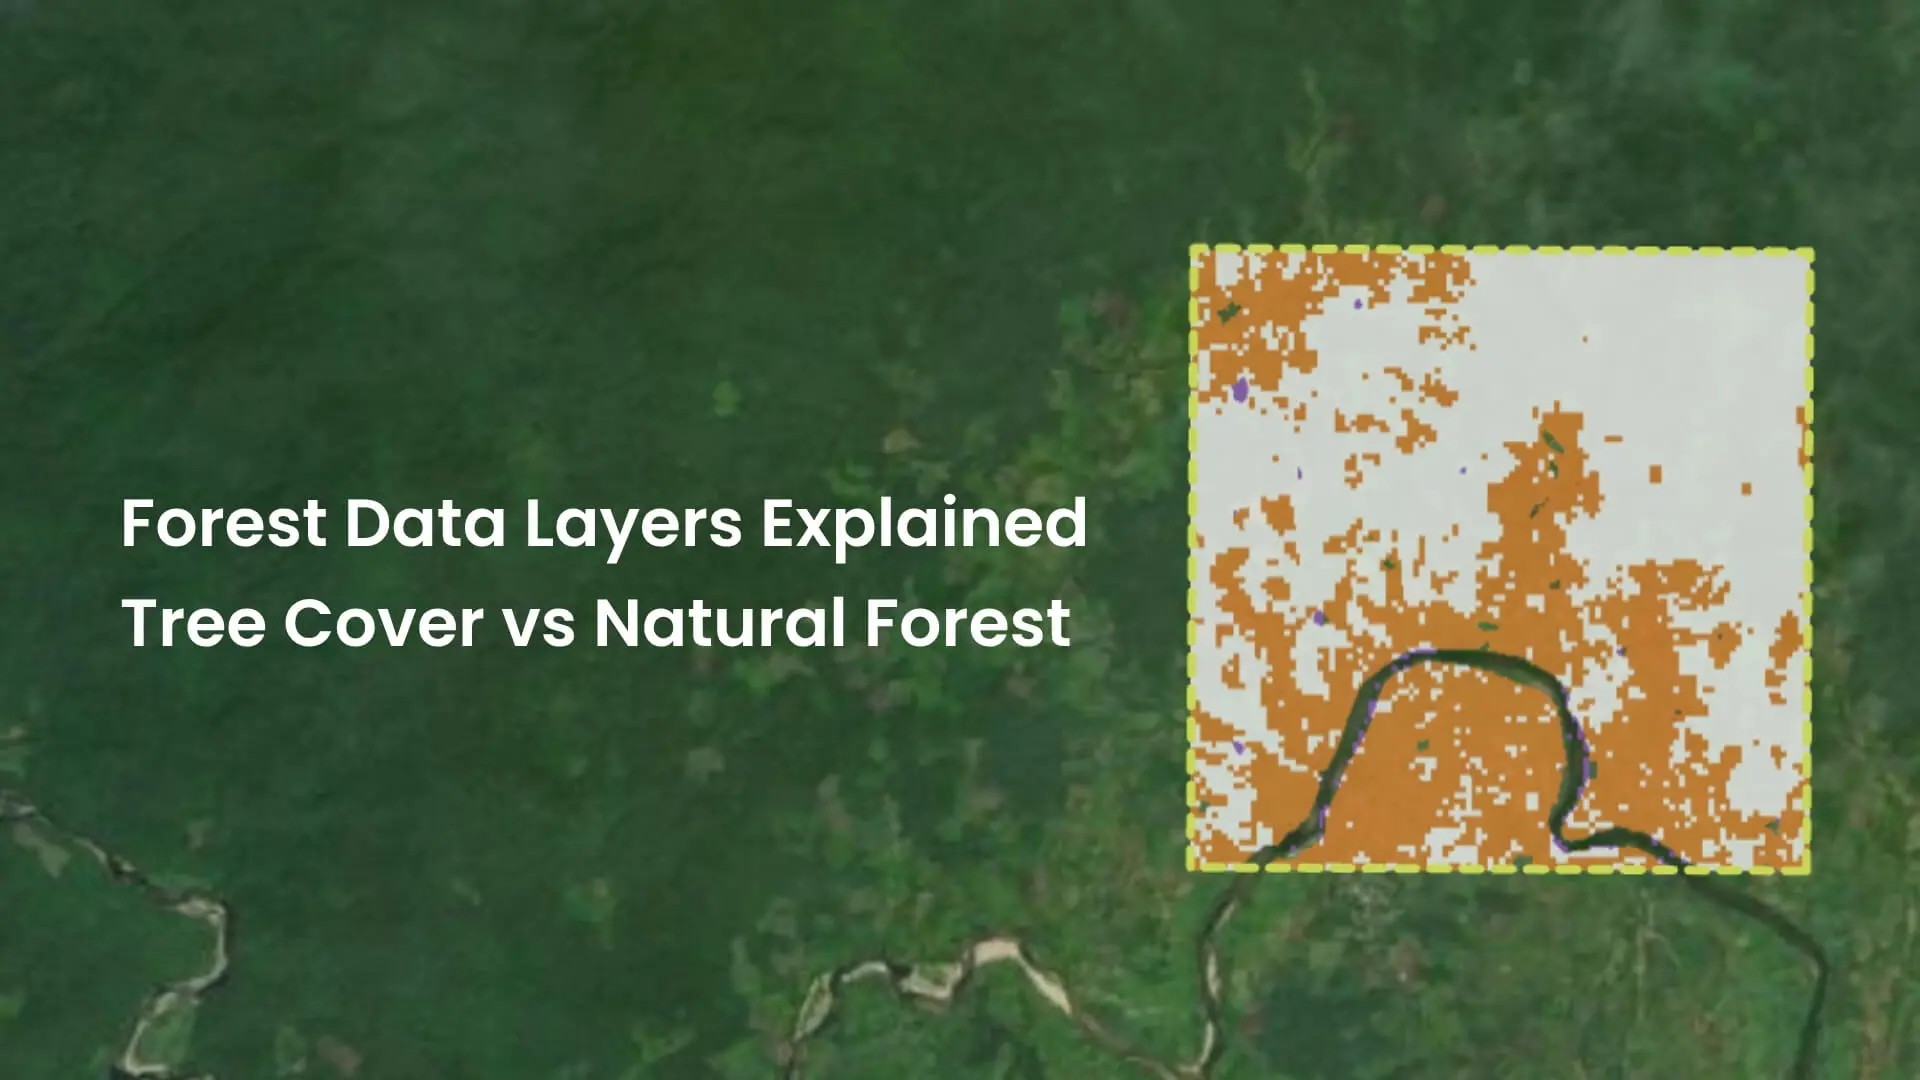
Key highlights
- Tree cover, canopy cover, forest land class and natural forest are related concepts, but each forest layer measures something different.
- Tree-cover datasets such as ESA WorldCover count any tree-dominated pixel, including oil palm, rubber and timber plantations.
- Forest land-class layers such as JRC Global Forest Cover 2020 follow the FAO definition, exclude agricultural tree crops and serve as the EUDR baseline.
- Natural forest layers exclude all plantations, which makes them better suited to biodiversity assessments and no-conversion commitments.
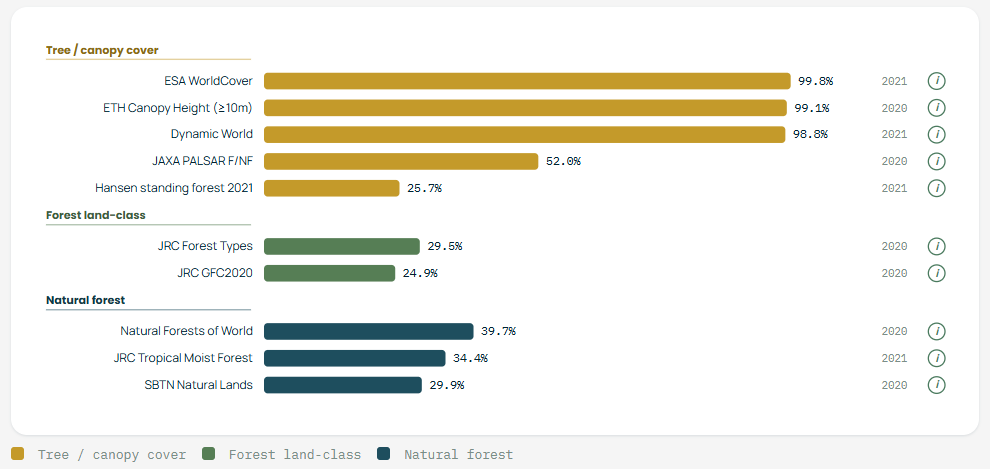
How much forest is in this landscape? In Kalimantan, the answer ranges from 99.8% to 29.9%, depending on which public dataset you open.
Neither number is wrong. ESA WorldCover counts any tree-dominated pixel, including oil palm. The SBTN Natural Lands Map counts only natural land. The right forest layer is the one whose definition matches the outcome your landscape initiative wants to achieve. If your goal is to protect natural forest and your layer counts oil palm as forest, you could report stable forest cover while the impact you care about moves the other way.
Choose a forest layer, measure the area classified as forest and calculate a percentage.
But compare several public forest data layers for the same landscape and you may get noticeably different answers.
One layer may show a continuous block of forest. Another may identify only part of it. A third might include plantations or scattered trees that another dataset excludes.
The reason is simple: Not every forest layer is measuring the same thing.
Tree cover, canopy cover, forest land class and natural forest are related concepts, but they are not interchangeable. Different datasets use different definitions, thresholds, spatial resolutions and methodologies.
Understanding those differences is essential before using a forest data layer for monitoring, conservation, carbon assessments, EUDR analysis or other land-use decisions.
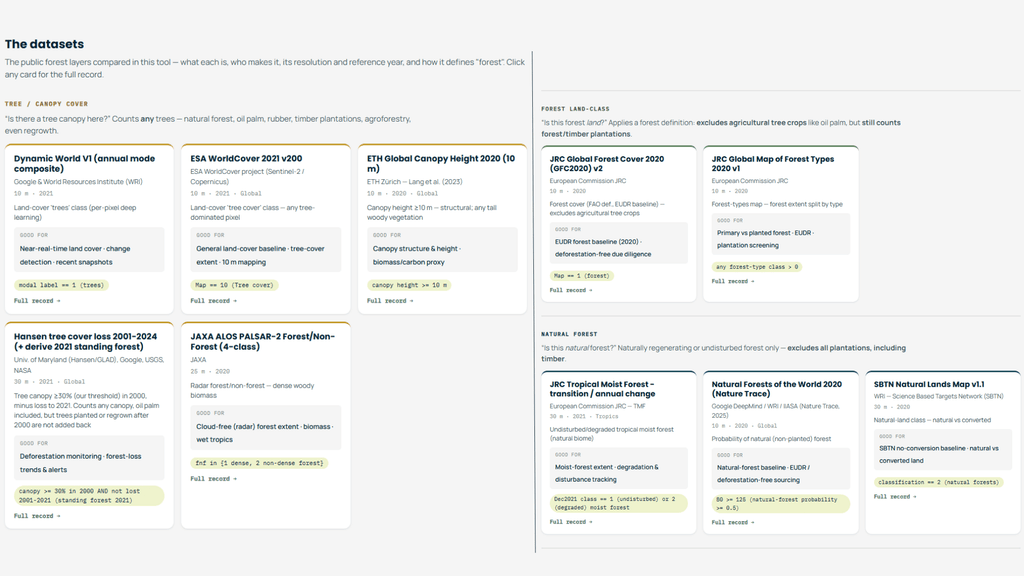
We built the Forest Layers comparator to make those differences easier to see, using ten public datasets across nine tropical landscapes.
What is a forest layer?
A forest layer is a geospatial dataset that represents some characteristic related to forests across a landscape.
It may show, for example:
- where trees are present;
- how dense the canopy is;
- where land is classified as forest;
- where natural forest remains;
- where forest has been lost;
- or where woody vegetation exceeds a particular height or canopy threshold.
These layers are usually derived from satellite imagery, radar, remote sensing models, land-cover classifications or combinations of different data sources.
On a map, many of them can look very similar. But what each pixel actually means can be very different, and that distinction becomes important as soon as the data is used to make a decision.
Tree cover is not necessarily forest
One of the most common sources of confusion is the difference between tree cover and forest.
A tree-cover dataset answers a narrow question: is there a tree canopy here? It counts any trees that meet its physical criteria, such as a minimum height or percentage of canopy coverage.
That can include many types of land. For example:
- natural forests;
- oil palm and rubber;
- timber plantations;
- agroforestry systems;
- orchards;
- recent regrowth;
- and, depending on the methodology, even groups of trees in urban areas.
ESA WorldCover, for instance, marks any tree-dominated pixel as tree cover. ETH Global Canopy Height goes further from land use still, mapping canopy height. In the comparator we count vegetation of ten metres or more as forest, which is a structural measure rather than an ecological one.
A satellite can identify the physical presence of trees without necessarily knowing why those trees are there or how the land is being used.
So a tree-cover layer should not automatically be interpreted as a natural forest map.
This distinction can be critical. If you are interested in vegetation structure, tree cover may be exactly what you need. If your question is about natural ecosystems, biodiversity or land-use regulation, it may not be enough.
What is canopy cover?
Canopy cover describes how much of the ground is covered by the vertical projection of tree crowns when viewed from above.
Imagine looking straight down at a forest. A dense closed-canopy forest might have very high canopy cover. A woodland with widely spaced trees may have much lower canopy cover, even though trees are still an important part of the ecosystem.
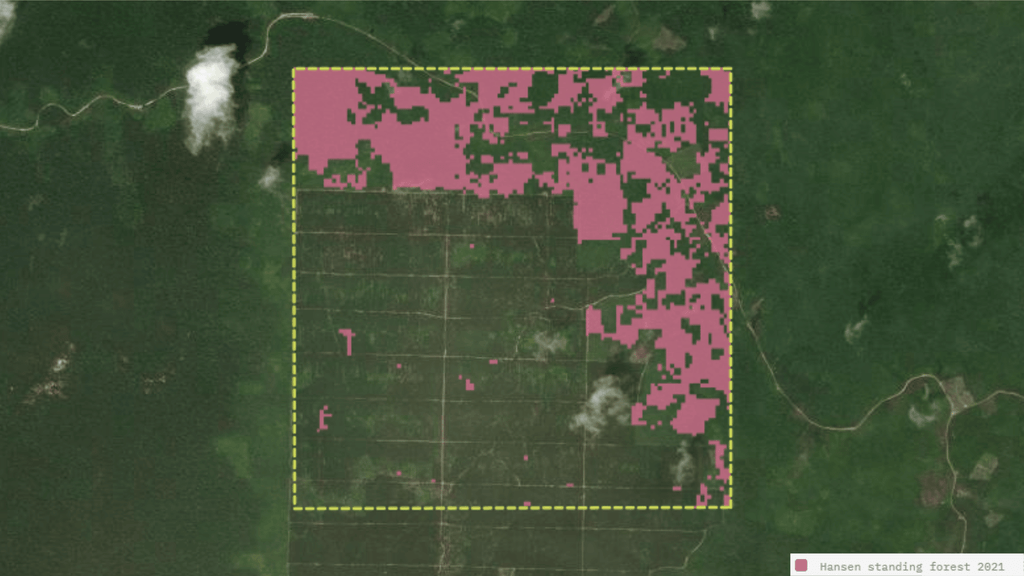
Many forest datasets apply a minimum canopy-cover threshold. Hansen Global Forest Change, for example, gives only percent tree cover. In the comparator we count a pixel as forest when canopy cover was at least 30% in the year 2000. Change that threshold and the amount of mapped forest changes with it. The time logic matters too. Hansen subtracts all forest lost since 2000 and does not add new plantings back, so it reads much lower than other tree-cover layers wherever forest was cleared after 2000. In Kalimantan it reads 25.7% forest, against about 99% for the others. Same family, but different time logic.
This means two datasets can use similar satellite observations but still produce different forest areas because their definitions of what counts as sufficient canopy differ.
Neither result is necessarily wrong. They may simply be answering different questions.
Forest land class: looking at land use, not only trees
A forest land class takes a different approach.
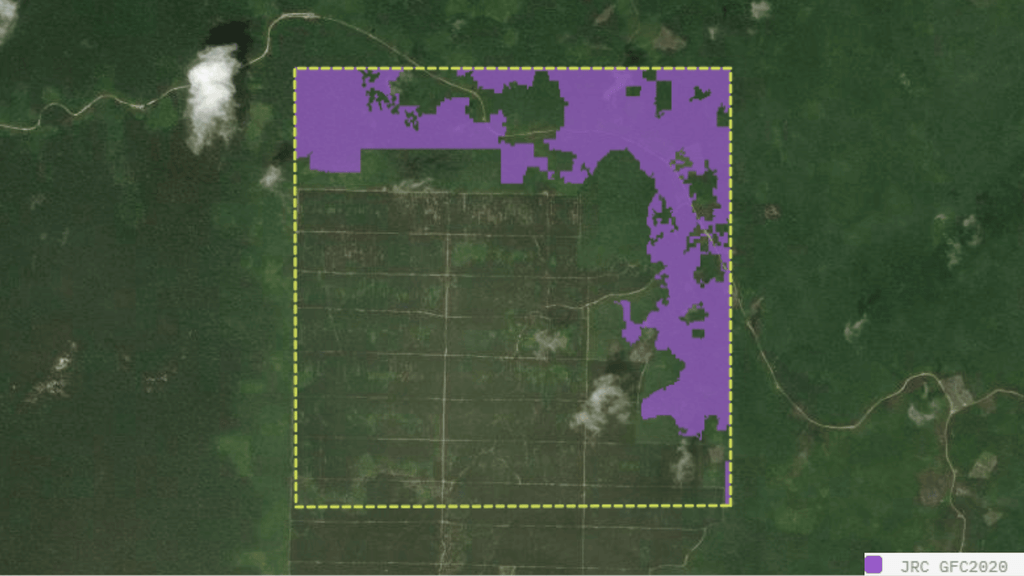
Rather than asking only whether trees are physically present, a land-classification dataset applies a forest definition. The JRC Global Forest Cover layer follows the FAO definition and excludes agricultural tree crops such as oil palm, but it still counts forest and timber plantations. That single boundary explains a large share of the disagreement between land-class layers and tree-cover layers in oil palm and cocoa landscapes.
Consider a recently harvested forest plantation. A tree-cover layer may temporarily show little tree cover, while a forest land-class dataset may still classify the area as forest because forestry remains the designated land use.
The reverse can also happen. An agricultural area containing substantial tree cover may appear in a tree-cover map but remain classified as agricultural land.
So before using a forest land class, it is worth asking:
Does this dataset represent what is physically covering the land, or how the land itself is classified?
And what counts as natural forest?
The distinction becomes even more important when the question is about natural forest.
A natural forest layer excludes all plantations, timber included, and keeps only naturally regenerating or undisturbed forest. That sounds straightforward, but making the distinction consistently at large scale is difficult.
A satellite sees spectral information, vegetation structure and changes over time. It does not directly see concepts such as ecological origin, management history or biodiversity value.
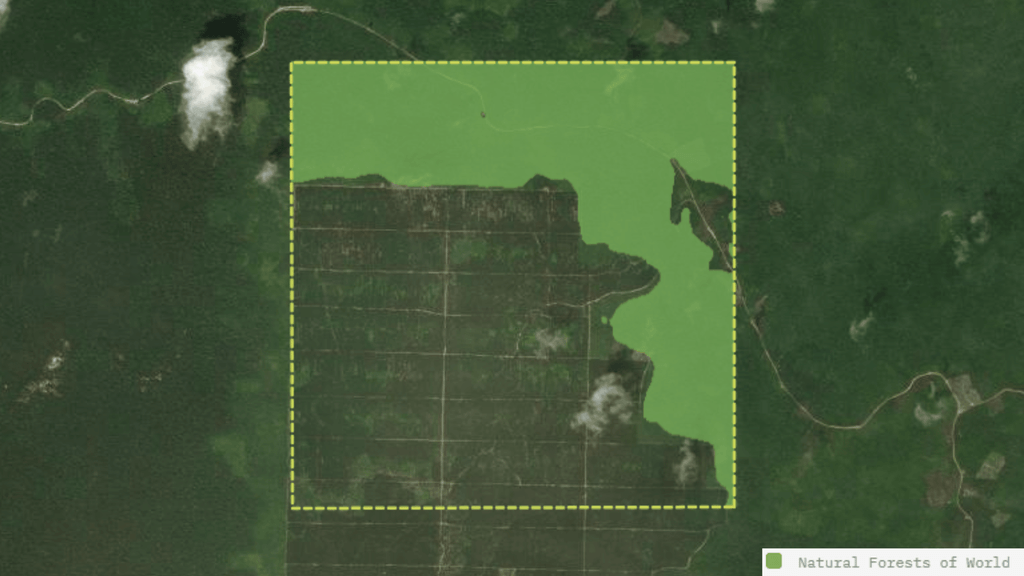
The datasets therefore reach the answer in different ways. Natural Forests of the World assigns each pixel a probability of being non-planted, so you choose where to set the cut-off. In the comparator we count a probability of 0.5 or more as natural forest. The SBTN Natural Lands Map uses a natural versus converted classification built for no-conversion baselines. JRC Tropical Moist Forest separates undisturbed from degraded moist forest within the natural biome. Three reasonable methods, three different maps.
This is why natural forest, tree cover and forest land class should never automatically be treated as synonyms.
The layers compared
The comparator groups ten public datasets into the three families described above.
Tree and canopy cover
| Dataset | Source | Resolution and year | What it marks as forest |
|---|---|---|---|
| Dynamic World V1 | Google and WRI | 10 m, 2021 | Land-cover ‘trees’ class, per-pixel deep learning |
| ESA WorldCover 2021 v200 | ESA, Sentinel-2 | 10 m, 2021 | Land-cover ‘tree cover’ class, any tree-dominated pixel |
| ETH Global Canopy Height | ETH Zürich, Lang et al. 2023 | 10 m, 2020 | Canopy height. In the comparator, ten metres or more |
| JAXA ALOS PALSAR-2 Forest/Non-Forest | JAXA | 25 m, 2020 | Radar forest class, dense and non-dense forest |
| Hansen tree cover loss 2001 to 2024 | UMD, Google, USGS, NASA | 30 m, 2021 | Percent tree cover. In the comparator, 30% or more in 2000, minus all loss since, with no new plantings added back |
Forest land class
| Dataset | Source | Resolution and year | What it marks as forest |
|---|---|---|---|
| JRC Global Forest Cover 2020 v2 | European Commission JRC | 10 m, 2020 | FAO definition, EUDR baseline, excludes agricultural tree crops |
| JRC Global Map of Forest Types 2020 v1 | European Commission JRC | 10 m, 2020 | Forest extent split by type, primary against planted |
Natural forest
| Dataset | Source | Resolution and year | What it marks as forest |
|---|---|---|---|
| JRC Tropical Moist Forest | European Commission JRC | 30 m, 2021 | Undisturbed or degraded tropical moist forest |
| Natural Forests of the World 2020 | Google DeepMind, WRI, IIASA (Nature Trace) | 10 m, 2020 | Probability of natural, non-planted forest. In the comparator, 0.5 or more |
| SBTN Natural Lands Map v1.1 | WRI, Science Based Targets Network | 30 m, 2020 | Natural land class, natural against converted |
Reference years run from 2020 to 2021 and resolutions from 10 to 30 metres, which is worth holding in mind when the differences appear. Some of the gap between two layers is definition. Some of it is simply a different year or a coarser grid.
Same landscape. Different forest data layers.
This is much easier to understand visually than in theory.
While working on a project, we needed to compare different publicly available forest datasets for the same landscapes. The exercise quickly showed how much the answer to a seemingly simple question could depend on the forest layer being used.
That led us to build the Forest Layers comparator.
It covers nine tropical landscapes, from Masoala in Madagascar and Nouabalé-Ndoki in Congo to the Côte d’Ivoire cocoa belt, Kalimantan, the Western Ghats, Darién, Mato Grosso, the Brazilian Atlantic Forest and the Central African Republic. For each one, the layers are pulled from Google Earth Engine, reduced to binary forest masks on a common 10 metre grid in local UTM, clipped to a 10 km² area of interest and compared pixel by pixel. All ten layers apply in eight of the landscapes. The Central African Republic has nine, because JRC Tropical Moist Forest does not cover that area. Every dataset carries a link to its full record, so you can check the definition behind the number rather than taking the number on its own.
Switch between the layers and the differences become visible immediately. Areas appear or disappear, forest boundaries shift, and the estimated amount of forest moves with them. Some layers are more inclusive, others more selective.
The landscape matters as much as the layer. In Nouabalé-Ndoki, where most of the forest is intact and unplanted, all ten datasets read between 97% and 100% forest. In the cocoa belt or an oil palm frontier, where the plantation boundary does most of the work, they separate sharply.
The point is not to find the layer that produces the “correct” number. It is to understand why the numbers differ.
Why comparing forest layers directly can mislead
Putting two layers next to each other is useful. Comparing their total forest areas without understanding their methodology is not.
Take ESA WorldCover and the SBTN Natural Lands Map over the same landscape. One counts any tree-dominated pixel. The other keeps only natural land. In Kalimantan, an oil palm frontier, the first reads 99.8% forest and the second 29.9%. In the Côte d’Ivoire cocoa belt, it is 64.0% against 7.3%. It would be tempting to conclude that one of them is inaccurate.
But they are not measuring the same phenomenon. The gap is roughly the plantation, agroforestry and sparse woodland that one definition includes on purpose and the other excludes on purpose.
Before comparing numbers, ask:
Are these datasets actually trying to answer the same question?
If not, the difference between them is information, not necessarily an error.
How do you choose a forest layer that measures your impact goals?
There is no universally best forest data layer. Start from the outcome your landscape initiative wants to achieve, choose the indicator that shows progress towards it, then pick the dataset whose definition of forest matches that indicator. If you already work with a Theory of Change, this is the same logic applied to geospatial data.
If your goal is to track tree cover or canopy structure
A tree-cover or canopy-cover dataset may be appropriate. ESA WorldCover and Dynamic World are useful for general tree-cover extent, and ETH Global Canopy Height when structure and height matter, for example as a biomass proxy. In persistently cloudy wet tropics, the JAXA radar layer avoids the gaps that optical sensors leave.
If you need to separate forest from other land uses
A forest land class or broader land-cover dataset may be more relevant. This is particularly useful when forest needs to be understood alongside agriculture, grassland, settlements and other land classes.
If your goal is to protect natural forest or biodiversity
A natural forest dataset may be more appropriate than a general tree-cover layer. This distinction can matter for conservation, biodiversity assessments and questions where plantations should not be treated in the same way as naturally occurring forests.
If your goal is to track deforestation or degradation
You may need a dataset specifically designed to detect change over time rather than a static forest layer. Hansen covers 2001 to 2024, and JRC Tropical Moist Forest tracks degradation as well as clearance, which matters in landscapes where forest thins before it disappears. The baseline year, temporal frequency and definition of loss all become important.
If you report against EUDR or a no-conversion commitment
Start with the definition required by the regulation or methodology. Then identify which datasets can reasonably represent that definition. For EUDR, JRC Global Forest Cover 2020 is built as the forest baseline, and the JRC Global Map of Forest Types helps separate primary from planted. For no-conversion commitments, SBTN Natural Lands is designed for that purpose.
The question should determine the dataset, not the other way around.
Five questions to ask before choosing a forest data layer
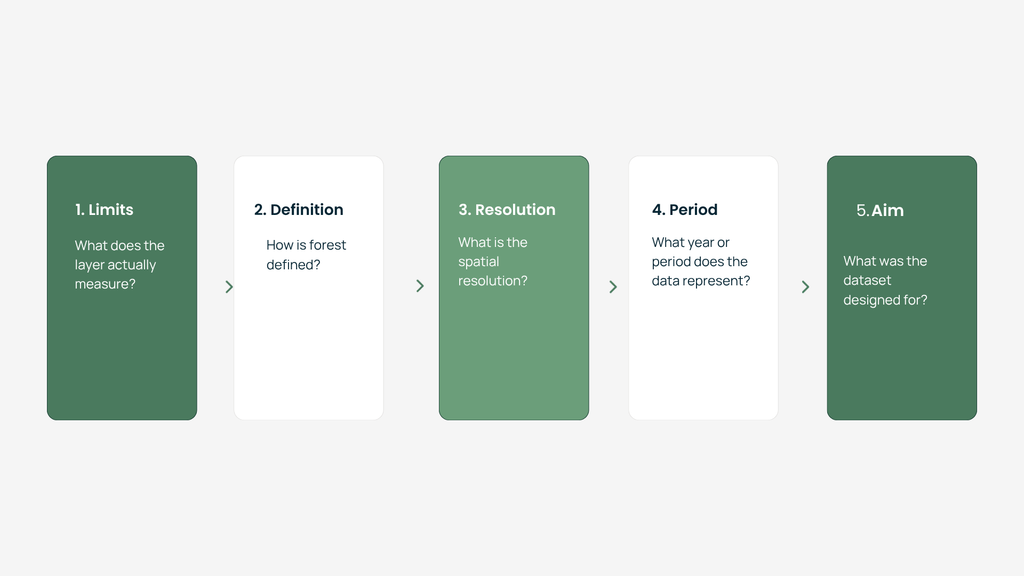
Before using any forest layer, it helps to understand at least five things.
1. What does the layer actually measure? Tree presence, canopy density, land cover, land use, natural forest or something else?
2. How is forest defined? Look at minimum canopy cover, tree height, area thresholds and any exclusions.
3. What is the spatial resolution? A 30 metre dataset and a 10 metre dataset may represent a fragmented cocoa landscape very differently.
4. What year or period does the data represent? Forest landscapes change. A high-quality dataset from the wrong year may still be unsuitable for your question.
5. What was the dataset designed for? A layer created for global change monitoring may not be the best choice for a site-level biodiversity assessment, and the reverse is equally true.
These questions often matter more than asking which dataset has the best-looking map.
More public data does not automatically mean more clarity
The amount of publicly available geospatial data has grown quickly, and that is a real opportunity for conservation organisations, restoration projects, researchers, companies and governments.
But access to more data also creates a new challenge: choosing the right data and interpreting it correctly.
A forest data layer is not the forest itself. It is a representation of the forest based on a particular definition, methodology and purpose.
That is why working with geospatial data should not start with: “Which layer can I download?”
It should start with: “What question am I trying to answer?”
Only then can we decide whether we need tree cover, canopy cover, a forest land class, natural forest or another type of dataset entirely.
Explore the forest layers yourself
The differences become much clearer once you see them on a real landscape.
Pick one of the nine landscapes, switch between the datasets and see how each one reads the same 10 km². Look at the boundaries, compare the forest estimates, and identify where the layers agree and where they diverge.
Then ask the most important question:
What is each forest layer actually telling me?
Because the layer you choose determines which version of the landscape you see.