Key Takeaways
- Impact monitoring for nature-based solutions measures whether a project is creating meaningful ecological and social change, not simply whether planned activities were completed.
- Trees planted, hectares restored and people trained are outputs. Credible impact monitoring also tracks outcomes such as ecosystem recovery, improved livelihoods and greater landscape resilience.
- The strongest NbS monitoring systems combine field observations, remote sensing and structured digital documentation rather than relying on a single source of evidence.
- A clear Theory of Change and credible baseline should guide indicator selection. Projects should decide what they need to demonstrate before choosing tools or collecting data.
- Monitoring data creates value when it is traceable, verified and connected to decisions. The goal is not to collect more data, but to improve projects and communicate results transparently.
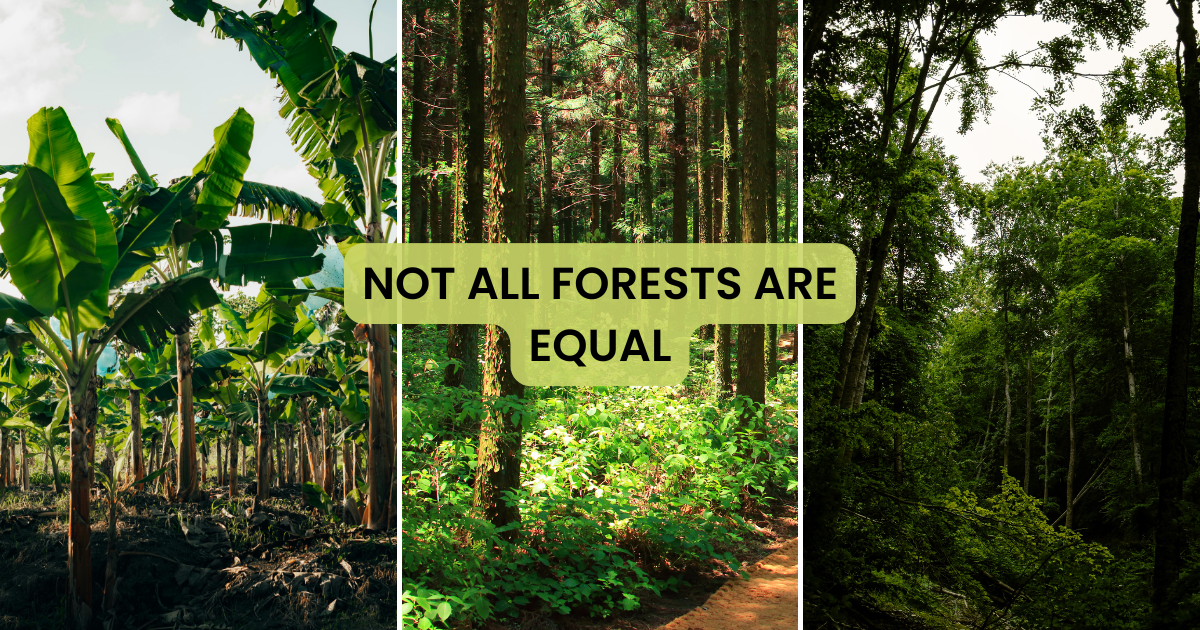
Nature-based solutions are receiving more attention, funding and political support than ever before. Yet the ability to monitor their impact has not always developed at the same pace.
For project teams, that gap has practical consequences. Planting 50,000 trees, restoring 200 hectares or training 300 farmers may demonstrate that activities took place. It does not yet show whether ecosystems are recovering, livelihoods are becoming more resilient or the intervention is addressing the societal challenge it was designed to solve.
This is where nature-based solutions monitoring becomes essential.
Impact monitoring for nature-based solutions is the systematic process of measuring, documenting and reporting whether a project is delivering its intended environmental and social outcomes over time. It normally combines ecological evidence, social and community information, implementation records, field observations, remote sensing and transparent documentation.
Good monitoring is not simply a reporting obligation. It helps project teams learn what is working, recognise problems earlier, adapt their approach and communicate more honestly with communities, funders, regulators and partners.
This guide explains how to monitor NbS projects in practice: what to measure, which methods to combine, how to select a framework and how to turn monitoring data into credible evidence.
What impact monitoring means for nature-based solutions
Monitoring is often discussed as though it were one clearly defined task. In reality, different organisations use the word to describe very different activities.
For one team, monitoring may mean counting surviving seedlings. For another, it means analysing annual forest-cover change. A donor may use monitoring to assess whether agreed milestones have been reached, while a community organisation may be more concerned with access to land, water security or livelihood benefits.
A credible NbS monitoring framework needs to connect these different perspectives.
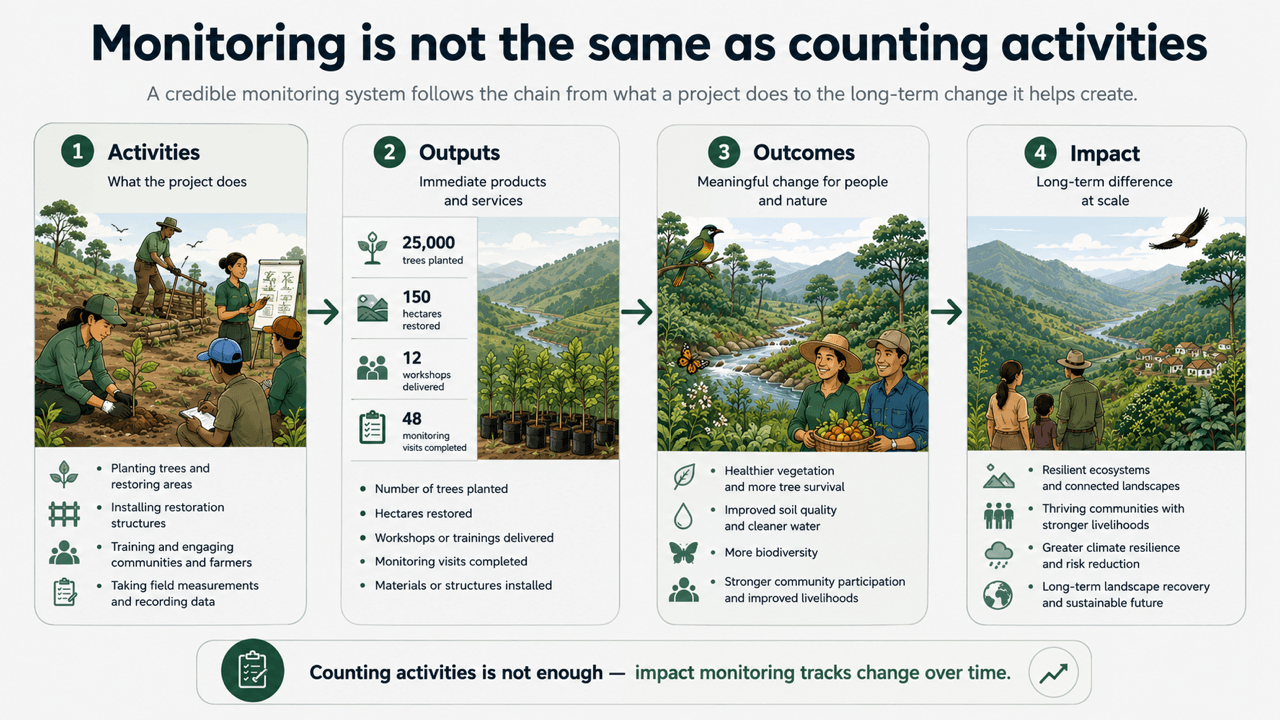
Monitoring is not the same as counting activities
A useful starting point is to distinguish between activities, outputs, outcomes and long-term impact.
- Activities are what a project does: planting, fencing, restoring waterways, training farmers or developing land-management agreements.
- Outputs are the immediate products of those activities: seedlings planted, hectares treated, workshops delivered or agreements signed.
- Outcomes are the changes that follow: increased vegetation cover, reduced erosion, improved habitat connectivity or more diversified household income.
- Impact is the longer-term contribution to ecosystem resilience, biodiversity recovery, climate mitigation, water security or human well-being.
This distinction matters because outputs are generally easier to count than outcomes.
A tree survival rate can be useful for understanding whether a planting method is working. But tree survival alone does not prove that a functioning ecosystem is developing. A plantation may have high survival and limited biodiversity. Conversely, a restoration area may lose some planted trees while natural regeneration, species succession and structural diversity continue to improve.
Monitoring should therefore follow the project’s full logic of change, rather than stopping at the most visible number.
How NbS monitoring differs from conventional project monitoring
Nature-based solutions are particularly challenging to monitor for several reasons.
Ecological change takes time. Some results can be observed within a season, while others take years or decades. Soil recovery, forest structure and species recolonisation rarely follow a reporting calendar.
Impact is spatially uneven. Two areas within the same project can respond differently because of soil, rainfall, land-use history, grazing pressure, fire or local management.
Multiple outcomes are interconnected. An intervention designed to reduce flood risk may also affect habitat, livelihoods, access to land and water quality. A narrow indicator set can overlook important benefits or trade-offs.
Many actors influence the result. Landowners, community organisations, government agencies, technical partners and funders may all contribute to implementation. External factors such as drought, commodity prices or policy changes can also affect outcomes.
Attribution is difficult. Observing more vegetation after an intervention does not automatically prove that the intervention caused it. Baselines, comparison areas and contextual information help determine whether an observed change is likely to be connected to project activities.
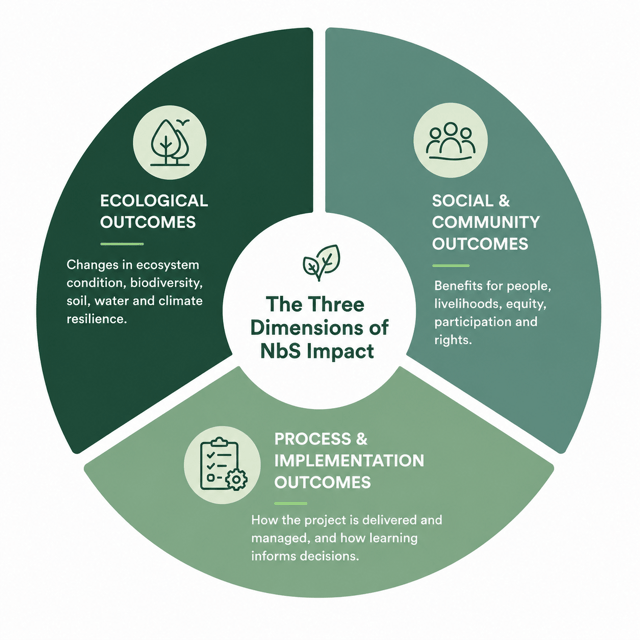
The three dimensions of NbS impact
A practical impact monitoring system can organise evidence into three connected dimensions:
- ecological outcomes;
- social and community outcomes;
- process and implementation outcomes.
Together, these dimensions help explain what changed, who benefited and how the project contributed to that change.
1. Ecological outcomes
Ecological monitoring asks whether ecosystem condition, function or resilience is changing.
Possible indicators include:
- native vegetation cover
- canopy structure
- forest loss or gain
- species richness
- abundance of indicator species
- habitat connectivity
- above-ground biomass
- soil organic carbon
- soil moisture
- erosion
- water quality
- water retention
- fire occurrence
The right indicator depends on the ecosystem and the project objective.
Canopy cover might be meaningful for assisted natural regeneration but insufficient for restoring native grassland, where increased woody cover could signal degradation rather than recovery. Likewise, NDVI may reveal changes in vegetation greenness but cannot, by itself, explain species composition, ecological quality or the cause of the change.
Indicators must therefore be interpreted in relation to the ecosystem, the baseline and the project’s objectives.
2. Social and community outcomes
Social outcomes show how an intervention affects people, institutions and access to resources.
Possible social indicators include:
- local employment
- household income
- livelihood diversification
- food and water security
- participation in decision-making
- representation of marginalised groups
- land-tenure security
- distribution of project benefits
- access to ecosystem services
- adoption of sustainable practices
- conflicts and grievances
- organisational capacity
These indicators require more than a one-time consultation. Participation in a workshop, for example, is an output. A stronger outcome indicator would examine whether community representatives influence decisions, whether agreed priorities are implemented or whether benefits are distributed as intended.
Qualitative methods are particularly important here. Interviews, focus groups, participatory mapping and outcome harvesting can reveal changes that are poorly represented by numerical indicators alone.
3. Process and implementation outcomes
Process indicators show whether the project is being implemented as planned and whether its management system can respond to new information.
Examples include:
- restoration activities completed
- hectares under active management
- planting survival
- maintenance visits
- monitoring visits
- budget execution
- stakeholder meetings
- grievances resolved
- alerts investigated
- data submitted on time
- corrective actions completed
- management decisions changed
Process monitoring does not replace impact monitoring. It helps explain it.
A project may fail to achieve an ecological target because the intervention was inappropriate. But it may also fail because implementation was delayed, livestock entered the site, maintenance was not completed or drought conditions were significantly different from the baseline period.
Without process data, teams can see that something changed but may not understand why.
Summary: dimensions, indicators and methods
| Monitoring dimension | Example indicators | Typical methods |
|---|---|---|
| Ecological | Canopy cover, biomass, biodiversity, soil condition, water quality, fire occurrence | Field plots, satellite imagery, drones, acoustic sensors, camera traps, soil and water sampling |
| Social and community | Employment, participation, tenure security, livelihood diversity, distribution of benefits | Surveys, interviews, focus groups, participatory mapping, administrative and financial records |
| Process and implementation | Survival rates, activities completed, budgets, stakeholder meetings, corrective actions | Field forms, geotagged photographs, project-management records, mobile applications and monitoring dashboards |
A robust monitoring plan does not need dozens of indicators in each category. It needs a manageable set that can explain whether the intervention was delivered, what changed and who benefited.
Choosing monitoring methods for your scale and budget
The right monitoring method depends on the question being asked.
Field surveys, satellite imagery, drones, sensors and digital records provide different kinds of evidence. They should be treated as complementary layers rather than competing alternatives.
The strongest monitoring systems usually combine at least two sources of information.
Field surveys
Field surveys are essential when an indicator requires direct measurement or local interpretation.
Forest inventories can measure tree diameter, height, species and biomass. Soil sampling can assess carbon, nutrients or compaction. Water sampling can examine turbidity and chemical conditions. Biodiversity surveys can identify species that cannot be reliably detected through satellite imagery.
Social outcomes also require direct engagement through surveys, interviews, focus groups and participatory methods.
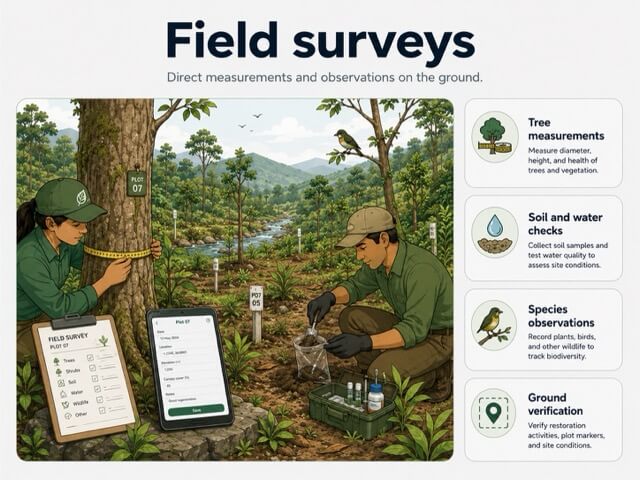
Field monitoring provides detail, but it is resource-intensive and spatially limited. Sampling design is therefore critical.
Projects should define:
- where observations will be collected
- how sites or participants will be selected
- which protocols will be used
- when measurements will take place
- how data quality will be checked
Changing methods between monitoring periods can make the results difficult to compare.
Satellite remote sensing
Satellite imagery is valuable when a project needs repeated observations across large or dispersed areas. Depending on the data source and analytical method, it can support the assessment of:
- land-cover change
- vegetation condition
- canopy development
- forest disturbance
- fire and burn scars
- water extent
- landscape fragmentation
- and seasonal patterns
Satellite archives can also provide historical context from before the intervention began.
However, remote sensing still requires interpretation.
A vegetation index may show that an area became greener. It cannot, by itself, determine whether this resulted from native restoration, crops, invasive vegetation or increased rainfall.
Field verification helps explain what the satellite signal represents.tcomes. A greening signal may reflect native regeneration, crops, invasive vegetation or seasonal rainfall. Field verification is needed to interpret the image correctly.

Drones and aerial surveys
Drones are useful when very high-resolution information is required for a defined site.
They can support:
- planting-area documentation
- canopy assessment
- erosion mapping
- elevation modelling
- restoration milestone surveys
- detailed visual communication
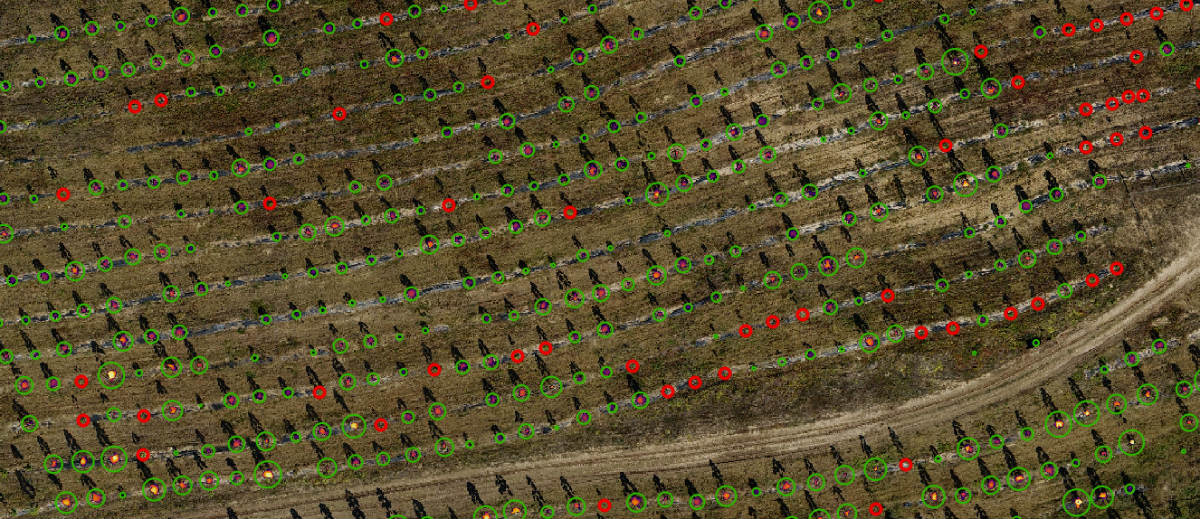
Drones sit between field surveys and satellite observations. They can cover more area than a field team while producing more detail than most satellite imagery.
Their limitations include flight regulations, weather, operator capacity, data-processing requirements and the cost of repeated surveys.
Environmental sensors
Sensors can provide frequent measurements of specific environmental conditions.
Examples include:
- soil moisture and temperature sensors
- weather stations
- stream gauges
- water-quality sensors
- acoustic recorders
- and camera traps
Their value lies in the questions they help answer, not in the amount of data they produce.
Before installing sensors, teams should determine:
- how the equipment will be maintained
- how it will be calibrated
- how the data will be transmitted
- who will review the results
- which management decisions the measurements will inform

Digital field documentation
Digital documentation is often one of the most accessible improvements a project can make.
Smartphone forms, geotagged photographs and structured activity records can document:
- where an activity occurred
- when it was completed
- who recorded it
- which evidence supports it
- which indicator it relates to
- and whether it has been reviewed
Digital documentation does not replace scientifically designed monitoring. It improves traceability and reduces the risk of valuable field information becoming scattered across private devices, messages and spreadsheets.
Which methods suit different project scales?
The following matrix provides a general starting point. The correct setup depends on ecosystem type, accessibility, risk, indicator complexity and reporting obligations.
| Project context | Recommended foundation | Complementary methods | Relative effort |
|---|---|---|---|
| Small, accessible site | Structured field monitoring and geotagged documentation | Open satellite data and targeted drone surveys | Low to medium |
| Medium or dispersed programme | Stratified field sampling and regular satellite analysis | Targeted drones, sensors and community monitoring | Medium to high |
| Large landscape programme | Satellite-led monitoring and representative field sampling | Alerts, automated sensors, local verification and targeted aerial surveys | High |
| Socially complex programme | Participatory and household monitoring connected to spatial project data | Ecological surveys and remote sensing | Medium to high |
| Carbon project | Methodology-compliant field and remote-sensing system | Independent validation and verification | High |
Monitoring costs vary according to geography, accessibility, sampling design, indicator complexity, reporting frequency and verification requirements.
For this reason, a realistic budget should be developed only after the monitoring questions and methods have been defined.
How to build an NbS monitoring plan
A monitoring plan should be designed before implementation wherever possible.
When monitoring is added later, projects often discover that baseline data is missing, indicators have changed and field records cannot be compared.
Five questions should be answered first.
1. What are you trying to demonstrate, and to whom?
Begin with the claims the project needs to substantiate.
Examples include:
- native vegetation is recovering
- erosion is decreasing
- habitat connectivity is improving
- household livelihoods are becoming more resilient
- restoration activities are happening in the agreed locations
- carbon stocks are increasing against a baseline
Then identify who needs the information.
A field manager may need an early warning that a site is underperforming. A community may need evidence that agreements and benefit-sharing arrangements are being respected. A donor may need progress against contractual outcomes. Each audience uses evidence differently.
Common mistake: beginning with a donor spreadsheet instead of clarifying the project’s own management and learning needs.
2. What is your baseline?
A baseline describes conditions before, or at the beginning of, an intervention.
It may include:
- land cover
- vegetation condition
- species composition
- soil and water conditions
- land use
- livelihoods
- governance arrangements
- environmental pressures
Where field data is unavailable, historical satellite imagery, previous studies, administrative data and local knowledge may help reconstruct earlier conditions.
A reconstructed baseline usually contains more uncertainty than one designed before implementation. That limitation should be documented.
3. Which indicators are informative and feasible?
Indicators should connect to the Theory of Change and support a real decision.
A useful indicator is:
- clearly defined
- relevant to an intended outcome
- measurable using an appropriate method
- sensitive to meaningful change
- feasible within the project’s capacity
- understandable to its users
“Improved biodiversity” is not yet a usable indicator.
A more precise definition might be: “Native bird-species richness recorded through standardised surveys at fixed monitoring locations during the same season each year.”
Each indicator should also specify:
- the unit
- geographic scope
- data source
- collection method
- frequency
- responsible person
- baseline
- target where appropriate
Common mistake: selecting too many indicators and measuring each one inconsistently.
4. How frequently will data be collected, and who is responsible?
Not every indicator needs to be measured at the same frequency.
Fire alerts may be reviewed continuously. Field activities might be documented monthly. Vegetation patterns may be assessed seasonally. Forest inventories may be repeated every few years.
Frequency should reflect:
- how quickly the variable changes
- seasonal patterns
- management urgency
- accessibility
- cost
- formal reporting requirements
Every indicator should also have assigned responsibility for collection, quality control, analysis, approval and reporting. Monitoring should not depend entirely on one GIS specialist or M&E officer.
Common mistake: choosing an ambitious monitoring frequency without allocating sufficient time, budget or ownership.
5. How will data be stored, verified and reported?
A monitoring plan is incomplete without data governance.
For each dataset, define:
- where the original record will be stored
- how locations and dates will be recorded
- which units and formats will be used
- who can edit or approve information
- how corrections will be tracked
- how sensitive information will be protected
- and which data can be shared
Verification should be proportionate to the purpose.
An internal management indicator may require a technical review. Donor reporting may require supporting documentation. Carbon issuance may require independent verification.
Common mistake: building a public dashboard before creating reliable workflows for the underlying evidence.
A practical NbS monitoring-plan template
A monitoring plan can be organised as follows:
- Project context and challenge
- Theory of Change
- Intended outcomes and impact claims
- Users of the monitoring information
- Baseline conditions
- Indicator definitions
- Data sources and methods
- Sampling design
- Monitoring frequency
- Roles and responsibilities
- Quality assurance
- Data storage and access rights
- Analysis and interpretation
- Reporting schedule
- Adaptive-management process
- Monitoring budget
- Risks, assumptions and limitations
The plan should remain usable by the people implementing it.
A shorter monitoring plan that consistently guides decisions is more valuable than a complex framework that nobody maintains.
Turning monitoring data into stakeholder evidence
Monitoring and communication are connected, but they are not the same task.
A technical monitoring report documents methods, assumptions, results, uncertainty and limitations.
Impact communication translates selected evidence into a form that a specific audience can understand.
The communication layer should simplify the presentation, not weaken the evidence.
Why location and time matter
Nature-based projects are location-based.
A result becomes more understandable when stakeholders can see:
- where an intervention occurred
- when evidence was collected
- which area an indicator represents
- how a location changed
- how field observations relate to the wider landscape
Geo-referenced and time-stamped evidence can connect an activity to a site, a photograph to a date and location, an indicator to the area it represents, a satellite alert to a follow-up visit or a funder’s contribution to the landscape it supports.
From static reports to living project records
Annual reports remain useful for formal reporting, but they capture one moment in time.
A digital monitoring system can provide a living project record. New field observations, indicators, satellite imagery and project stories can be added as the project develops.
This creates continuity between reporting periods and reduces the need to rebuild the evidence base for every report.
Dashboards and interactive maps also allow different audiences to explore different levels of detail.
A funder may start with a portfolio view and then open a specific project or intervention area. A technical user may examine a data layer. A public visitor may focus on project context and stories.
Private, shared and public information
Transparency does not mean publishing every record.
Projects may need to protect endangered-species locations, personal household data, Indigenous and local knowledge, land-tenure conflicts, culturally sensitive sites or restricted commercial information.
A well-designed system can support different access levels:
- private information for internal teams
- restricted views for partners or funders
- and selected public evidence for external communication
Communicating without overstating
Credible impact communication distinguishes between directly measured results, estimated results, outputs, outcomes and longer-term impact contributions.
It should always explain:
- the period covered
- the baseline used
- the method
- the geographic scope
- key assumptions
- remaining uncertainty
Being transparent about uncertainty does not weaken a project’s credibility. It demonstrates that the organisation understands the limits of its evidence.
Connecting Map, Monitor and Report
At OpenForests, we often structure impact systems around three connected functions.
Map
A reliable monitoring system begins with location. Project boundaries, properties, intervention sites, monitoring plots and landscape context create the spatial foundation for evidence.
Monitor
Monitoring connects the Theory of Change with measurable indicators and different data sources. Indicators should remain connected to the strategic goals and outcomes they are intended to measure.
Report
Approved monitoring information can then be transformed into dashboards, interactive maps, funder-specific views, public project pages or structured data exports.
Technology alone cannot create credible impact evidence. It can make a well-designed monitoring system easier to maintain, interpret and use.
Frequently asked questions
What is impact monitoring for nature-based solutions?
Impact monitoring for nature-based solutions is the systematic collection and interpretation of evidence showing whether a project is producing its intended ecological, social and operational outcomes.
It connects project activities with measurable changes and helps teams understand whether an intervention is working.
How do you monitor an NbS project?
Most NbS projects combine field surveys, remote sensing, environmental sensors, community information and structured project documentation.
The right combination depends on the ecosystem, project scale, intended outcomes, available budget and reporting requirements.
Which indicators are used in NbS monitoring?
Common indicators include: vegetation cover, biodiversity, biomass, soil condition, water quality, carbon stocks, livelihoods, participation, tenure security, restoration survival or adaptive-management actions.
The indicators should be connected to the project’s Theory of Change and management needs.
How do you build an NbS monitoring plan?
Begin by defining what the project wants to demonstrate and who will use the evidence.
Then establish the baseline, select feasible indicators, define methods and frequency, assign responsibilities and create procedures for data quality, storage, verification and reporting.
Can satellite data replace field monitoring?
No. Satellite data can reveal broad spatial and temporal patterns, but field data is needed to verify ecological conditions, identify species, understand local causes and measure social outcomes. The strongest monitoring systems combine both.
Is tree survival an impact indicator?
Tree survival is primarily an implementation or early outcome indicator.
It can show whether planting and maintenance methods are working, but it does not by itself demonstrate ecosystem recovery, biodiversity gains, carbon storage or livelihood benefits.
What is the difference between monitoring and MRV?
Monitoring is the ongoing collection and interpretation of information about project activities and outcomes.
MRV stands for measurement, reporting and verification. It normally refers to a more formal process in which results are quantified, documented and checked against defined requirements.
What makes an NbS impact report credible?
A credible impact report connects each claim to a defined indicator, method, location, period and baseline.
It distinguishes measured results from estimates and explains assumptions, limitations and uncertainty.