Map, monitor and report your impact. All in one connected system.
Digital tools for restoration and conservation organisations. Bring your project locations, environmental data and monitoring results together to understand change, track progress and share evidence with funders and partners.
Trusted by 900+ organisations, from local NGOs to global alliances
THE TOOLS
Use one Tool or combine them as your needs evolve
From project mapping and tree management to environmental monitoring and impact reporting, each Tool serves a specific purpose.
Start with the capabilities your organisation needs today and add more as your projects evolve. All Tools work from the same geographic foundation, keeping your project information connected.
Map & Manage
Organise your restoration and conservation projects, from landscapes to individual trees.
Maps
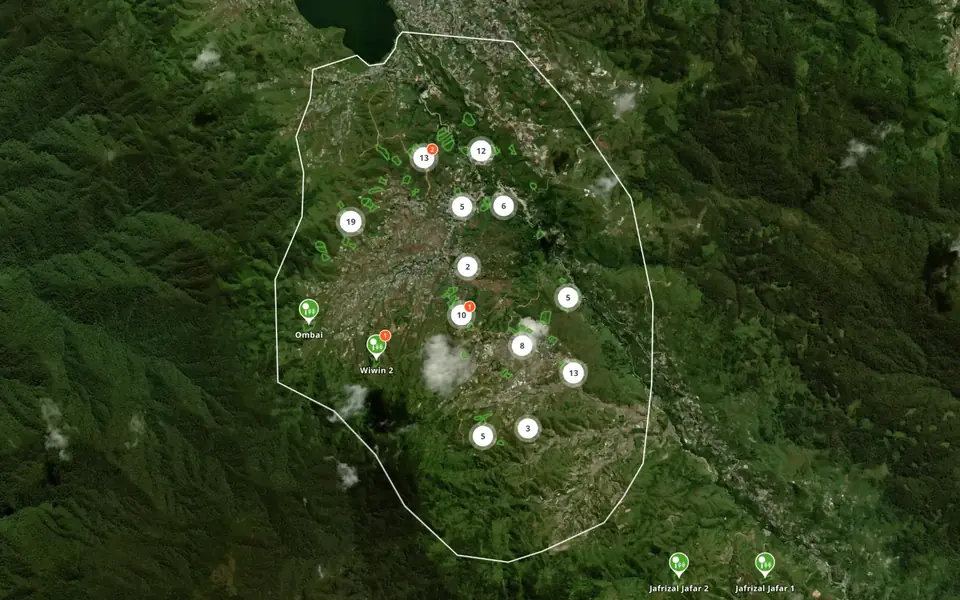
Interactive maps for restoration and conservation projects.
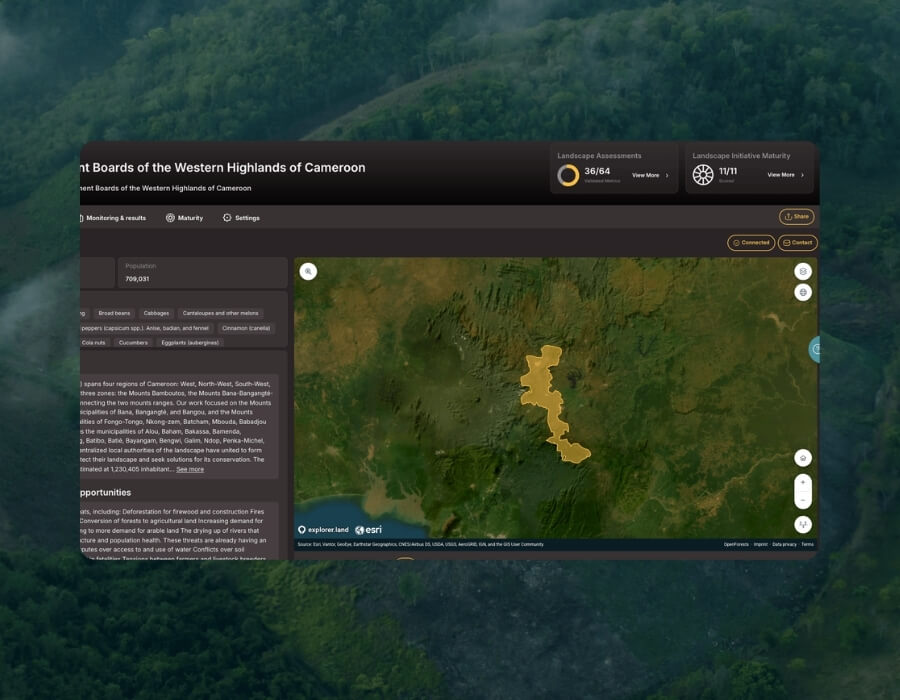
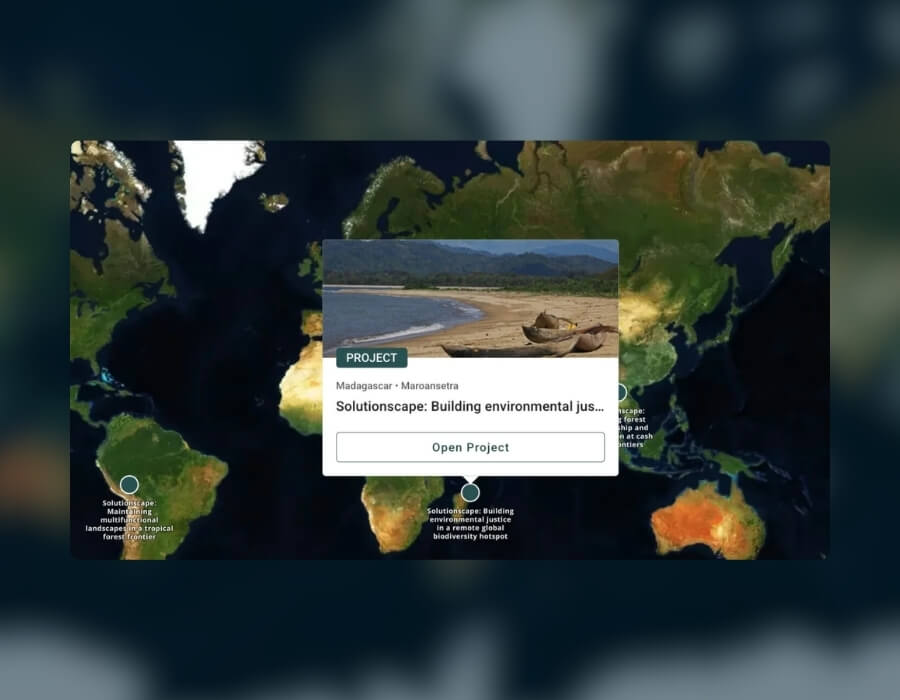
Map your project boundaries and sites, explore environmental data and share your work through interactive maps that can be embedded on your website.
Map sites, project areas and landscapes
Explore historical imagery and 30+ environmental data layers
Share or embed interactive project maps
Visualise change over time with satellite imagery
Tree Manager
Manage and monitor individual trees, groups and planting sites.
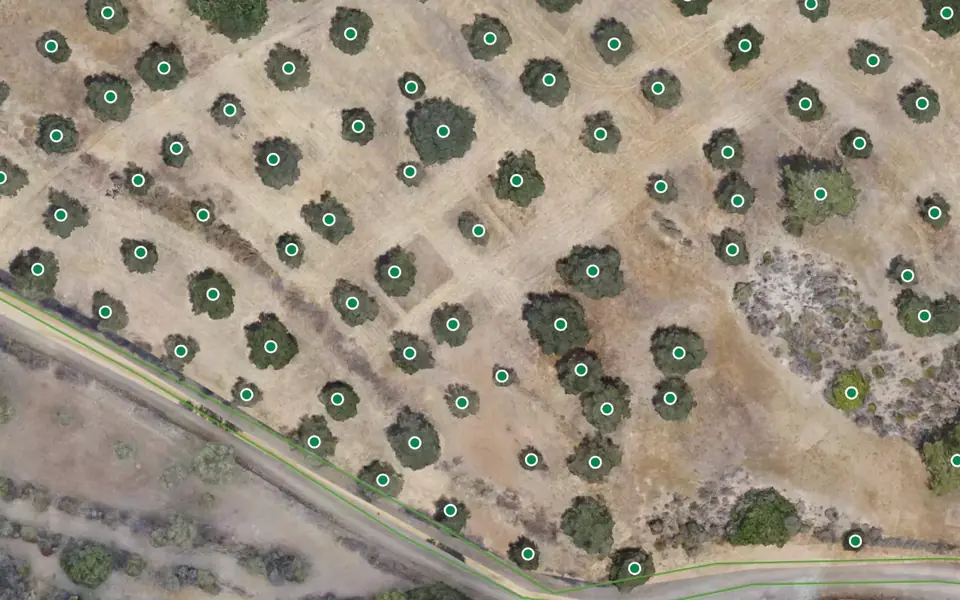
Organise tree records on high-resolution imagery, track survival and growth, and connect each tree to a persistent OpenTreeID.
Import and export tree data via CSV or API
Track survival and growth over time
Share trees, groups and sites through interactive maps
Aerial Imagery Management
Turn aerial imagery into detailed maps of your project sites.
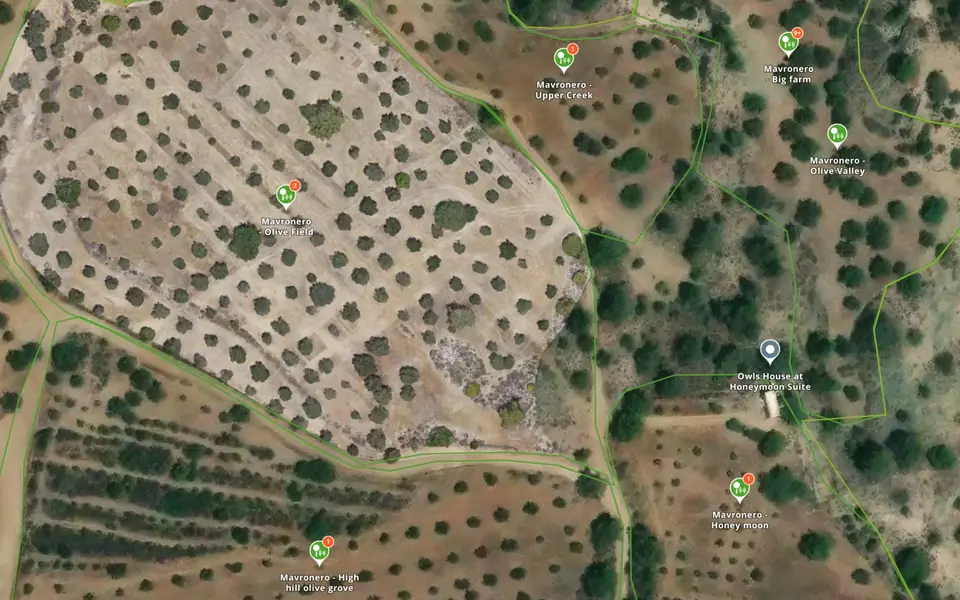
Upload drone, aircraft or satellite imagery to create and manage high-resolution map layers. Explore your sites in detail and compare imagery collected at different times.
Process drone photos into orthomosaics
Display imagery within project boundaries
Compare aerial imagery over time
Monitor
Track environmental change and assess progress towards your restoration and conservation goals.
Impact Monitoring System
Connect your Theory of Change to measurable results.
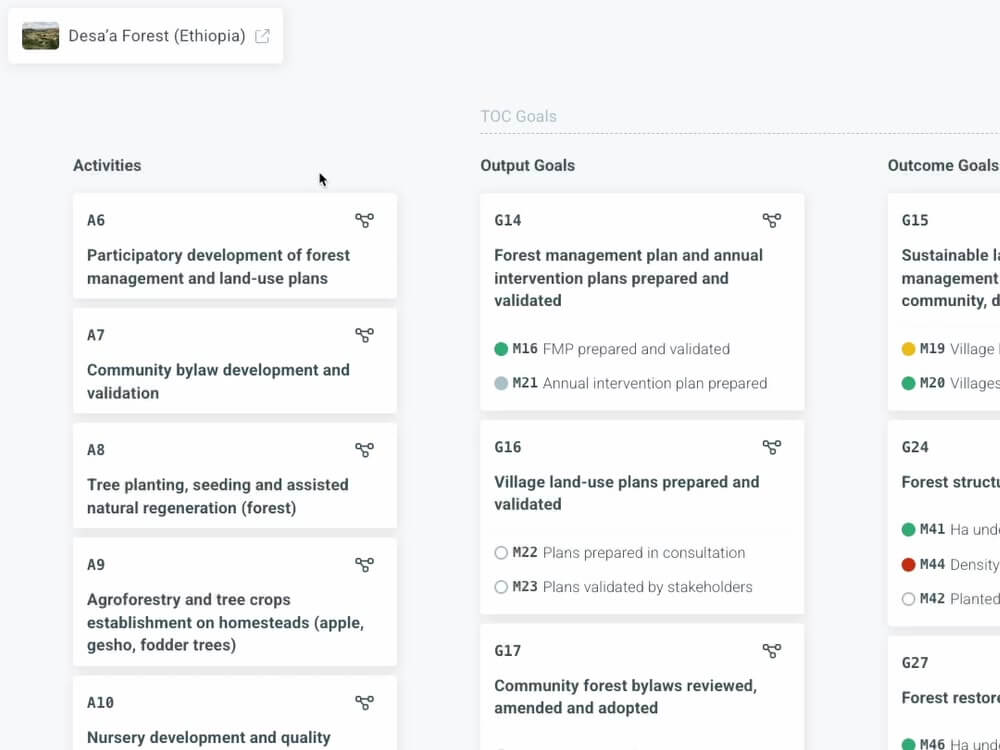
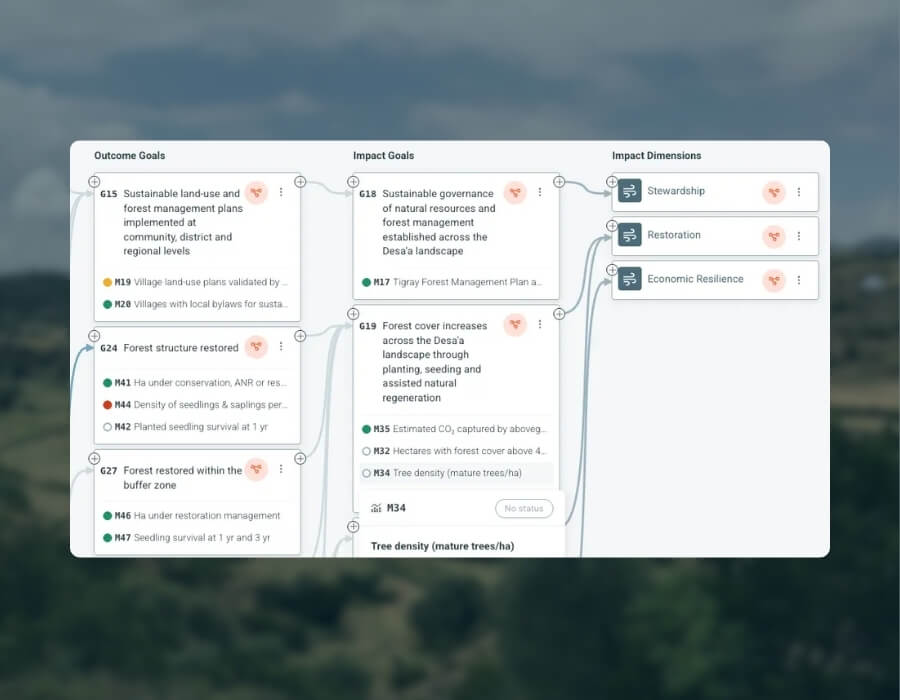
Build an interactive Theory of Change, define indicators and track progress from project activities and outputs to outcomes and long-term impact goals.
Map your results chain and underlying assumptions
Link indicators to activities, outputs and outcomes
Track progress towards project objectives
Geo-Analytics
Analyse environmental change using satellite and geospatial data.
Explore vegetation, canopy cover and land-cover changes across your project sites. Combine spatial datasets and apply indicators to support restoration and conservation monitoring.
Canopy height, tree cover loss and many more environmental data layers.
Track changes by site and over time
Apply SCS-NDVI and OpenAGB indicators
Report & Communicate
Connect funding contributions to projects, activities and monitoring results.
Sponsors & Claims
Manage funding contributions and communicate project progress.
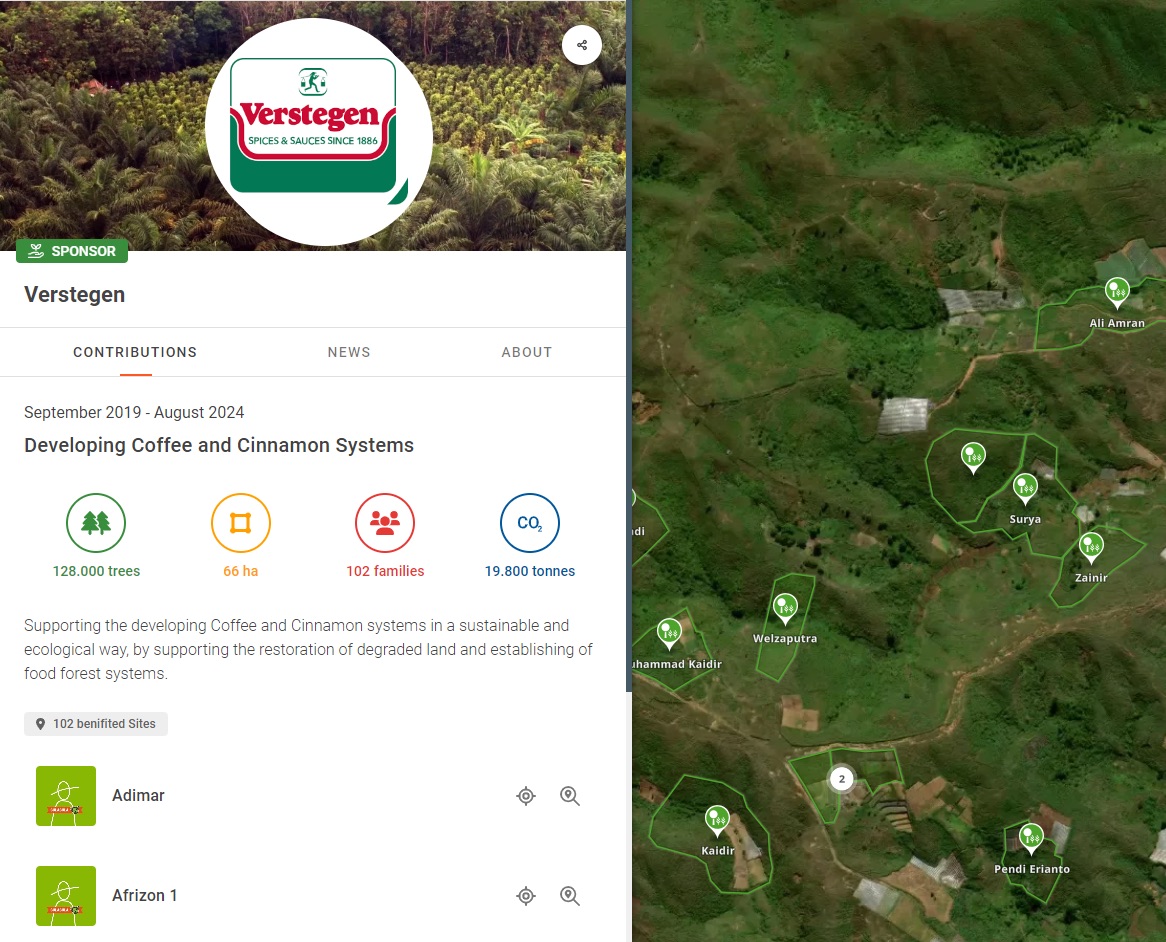
Connect sponsors to the projects and sites they support. Give each sponsor a dedicated view of their contributions and the monitoring information relevant to their reporting.
Link contributions to project sites
Provide dedicated sponsor views
Support environmental claims with relevant monitoring indicators
Environmental indicators
Measure environmental change with transparent methods
Our remote sensing team develops indicators to help restoration and conservation organisations analyse environmental change and report results with greater confidence.
Apply them through Geo-Analytics, connect them to your Impact Monitoring System, or work with our team to analyse your own data.
Beta
SCS-NDVI
Understand vegetation change against a comparable reference.
Synthetic Control Sites NDVI (SCS-NDVI), developed by OpenForests in collaboration with the Wyss Academy, compares vegetation development at intervention sites with synthetic control sites.
This helps assess how observed vegetation changes differ from an estimated reference trajectory without the intervention.
Illustrative values
Beta
OpenAGB
Forest biomass from open data, checked against LIDAR.
OpenAGB is our open method for mapping above-ground woody biomass at 10 m, every year since 2017. Every input, every label and every line of code is public, so anyone can re-run the tests.
Farmland-forest mosaic
r 0.92
vs airborne LIDAR · 3,360 cells
Closed forest
r 0.77
vs airborne LIDAR · 1,992 cells
Sites never seen in training
r 0.63
46 LIDAR sites, Brazil and Peru
Agreement with airborne LIDAR (r)
OpenAGB0.92
ESA CCI v60.43
NASA GEDI0.40
Above roughly 250 t/ha, satellite signals stop responding and every product reads low, this one included. Each pixel carries a calibrated 90% interval, so that uncertainty stays visible. Results are in tonnes per hectare (t/ha).
Source: OpenAGB, Explained (OpenForests, 7 Sep 2026). Mosaic landscape south of Santarém, Pará, 30 m cells, 2018 LIDAR.
From data to evidence
From mapping projects to reporting impact
Step 01
Map your projects
Define project boundaries, organise sites and bring your geographic information together.
Step 02
Manage your data
Organise tree records, integrate field information and manage high-resolution imagery across your sites.
Step 03
Monitor change
Connect your Theory of Change with environmental indicators and analyse how your project sites change over time.
Step 04
Report progress
Bring project information, monitoring results and funding contributions together to support transparent reporting.
OpenForests develops digital tools for restoration and conservation organisations to manage geographic information, monitor environmental change and report project progress. The Tools cover mapping, tree management, aerial imagery, geospatial analysis, impact monitoring and sponsor reporting.
Yes. Each Tool serves a specific purpose and can be used individually. Organisations can also combine Tools using the same shared project locations and information.
Yes. Our team can help organise and integrate geographic data and connect existing systems, including GIS platforms, field applications and databases. Customisation options depend on your organisation’s requirements.
The Impact Monitoring System links project objectives and Theory of Change elements with indicators. Geo-Analytics helps analyse environmental change using satellite imagery and other spatial datasets. Together, they support the assessment and reporting of restoration progress.
Yes. OpenForests supports organisations working across individual sites, multiple projects and larger landscapes. Connected geographic information helps teams organise monitoring and reporting across different locations.
explorer.land established the geographic foundation of OpenForests’ platform and continues to support its mapping capabilities. Today, we focus on individual Tools that can be used independently or combined to address specific mapping, monitoring and reporting needs.
If you already use explorer.land, our team can help you understand how the Tools relate to your existing setup.
“
OpenForests’ web map has been a fantastic tool to visualize our reforestation project El Silencio for fundraising.
Fernando Arbeláez · President · Fundación Biodiversa Colombia
Start today
Find the right Tools for your projects
Start with an interactive map or work with our team to build a monitoring and reporting system tailored to your organisation.
Your project data stays connected as you add new capabilities.
 Book a call